I Replaced My Gaming Backlog App with a Spreadsheet
I have 217 games across Steam, PlayStation and Switch. I know this because I counted. Before the spreadsheet, I would have guessed maybe 80. The real number made me sit down for a minute.
Most of them have never been launched. Some were bought on sale three years ago. A few were free with PlayStation Plus and I forgot they existed. The backlog kept growing and I had no system for deciding what to play next. I just scrolled through menus until something caught my eye. That mess is what eventually led me to build PlayFlux, but let me walk through what I tried first.
What Backloggd does well (and what it doesn't)
Backloggd is a solid app for logging games. You rate them, mark them as played, write reviews. The community features are nice if you want to see what other people think about a game before you buy it.
But it doesn't track hours played. It doesn't track spending. There's no way to see your completion percentage across your whole library, and platform analytics don't exist. You can't answer "how much did I spend on games this year?" or "what percentage of the games I own have I actually finished?"
Those are the questions I actually care about.
The HowLongToBeat problem
HowLongToBeat is useful for one specific thing: checking how long a game takes before you buy it. I still use it for that. But it tells you how long games take on average. It doesn't tell you how long YOUR games took YOU.
I beat Elden Ring in 94 hours. The HowLongToBeat average is around 55 for main story plus extras. My number is my number. I explore every corner, I get lost constantly, I spend too long on character builds. No app knows that about me. Only my own data does.
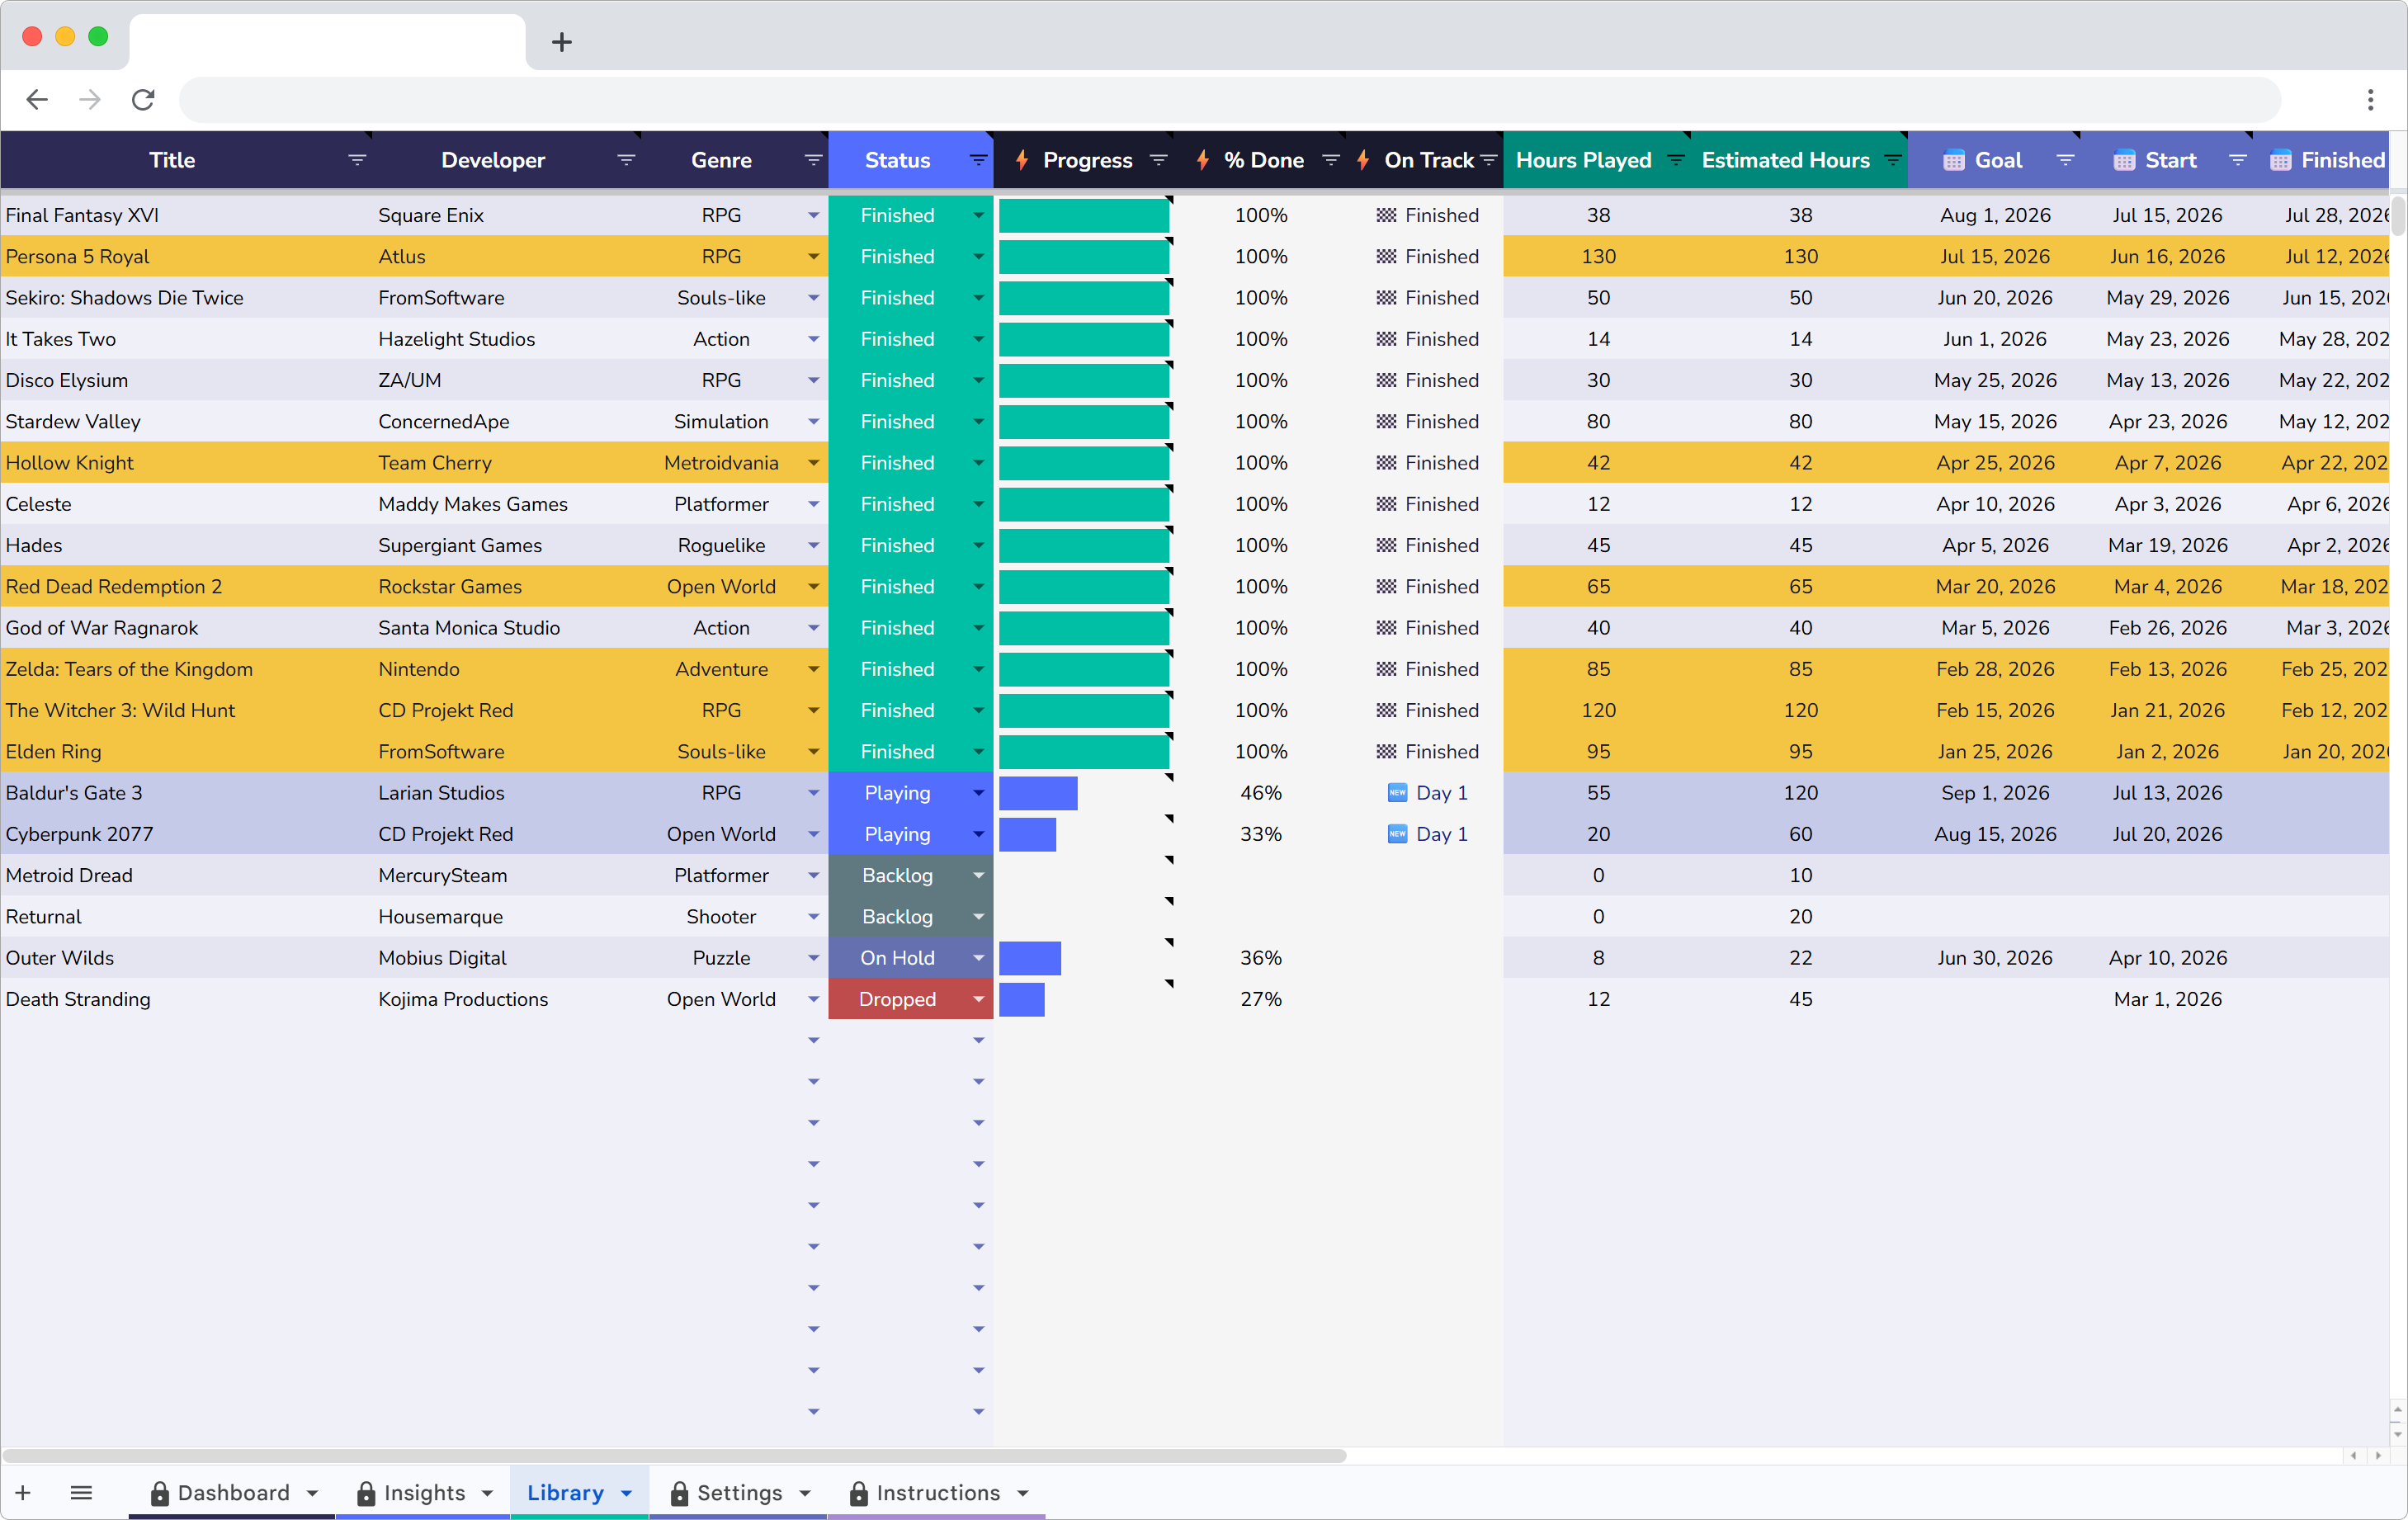
What the spreadsheet tracks
Every game gets a row with these columns:
- Title and platform – PC, PS5, Switch, etc.
- Genre – RPG, action, indie, strategy, etc.
- Hours played – pulled from Steam or estimated manually
- Cost – what I actually paid, not retail price
- Date started and date finished – the two dates that power all the analytics
- Rating – 1 to 5
- Status – backlog, playing, completed, dropped
Adding a game takes about 20 seconds. The dashboard and charts update on their own.
The spending wake-up call
I spent $412 on games last year and finished 12 of them. That's $34 per finished game.
Some of those finished games cost me $5. The ones dragging the average up were full-price purchases I played for three hours and never touched again. Two $70 games I bought at launch are sitting in the backlog untouched. That's $140 doing nothing.
Seeing that number changed how I buy games. I wait for sales now. I check my backlog before buying anything new. If I already own something similar in the same genre, the new game can wait. The spreadsheet turned an abstract feeling ("I spend too much on games") into a specific dollar amount I could act on.
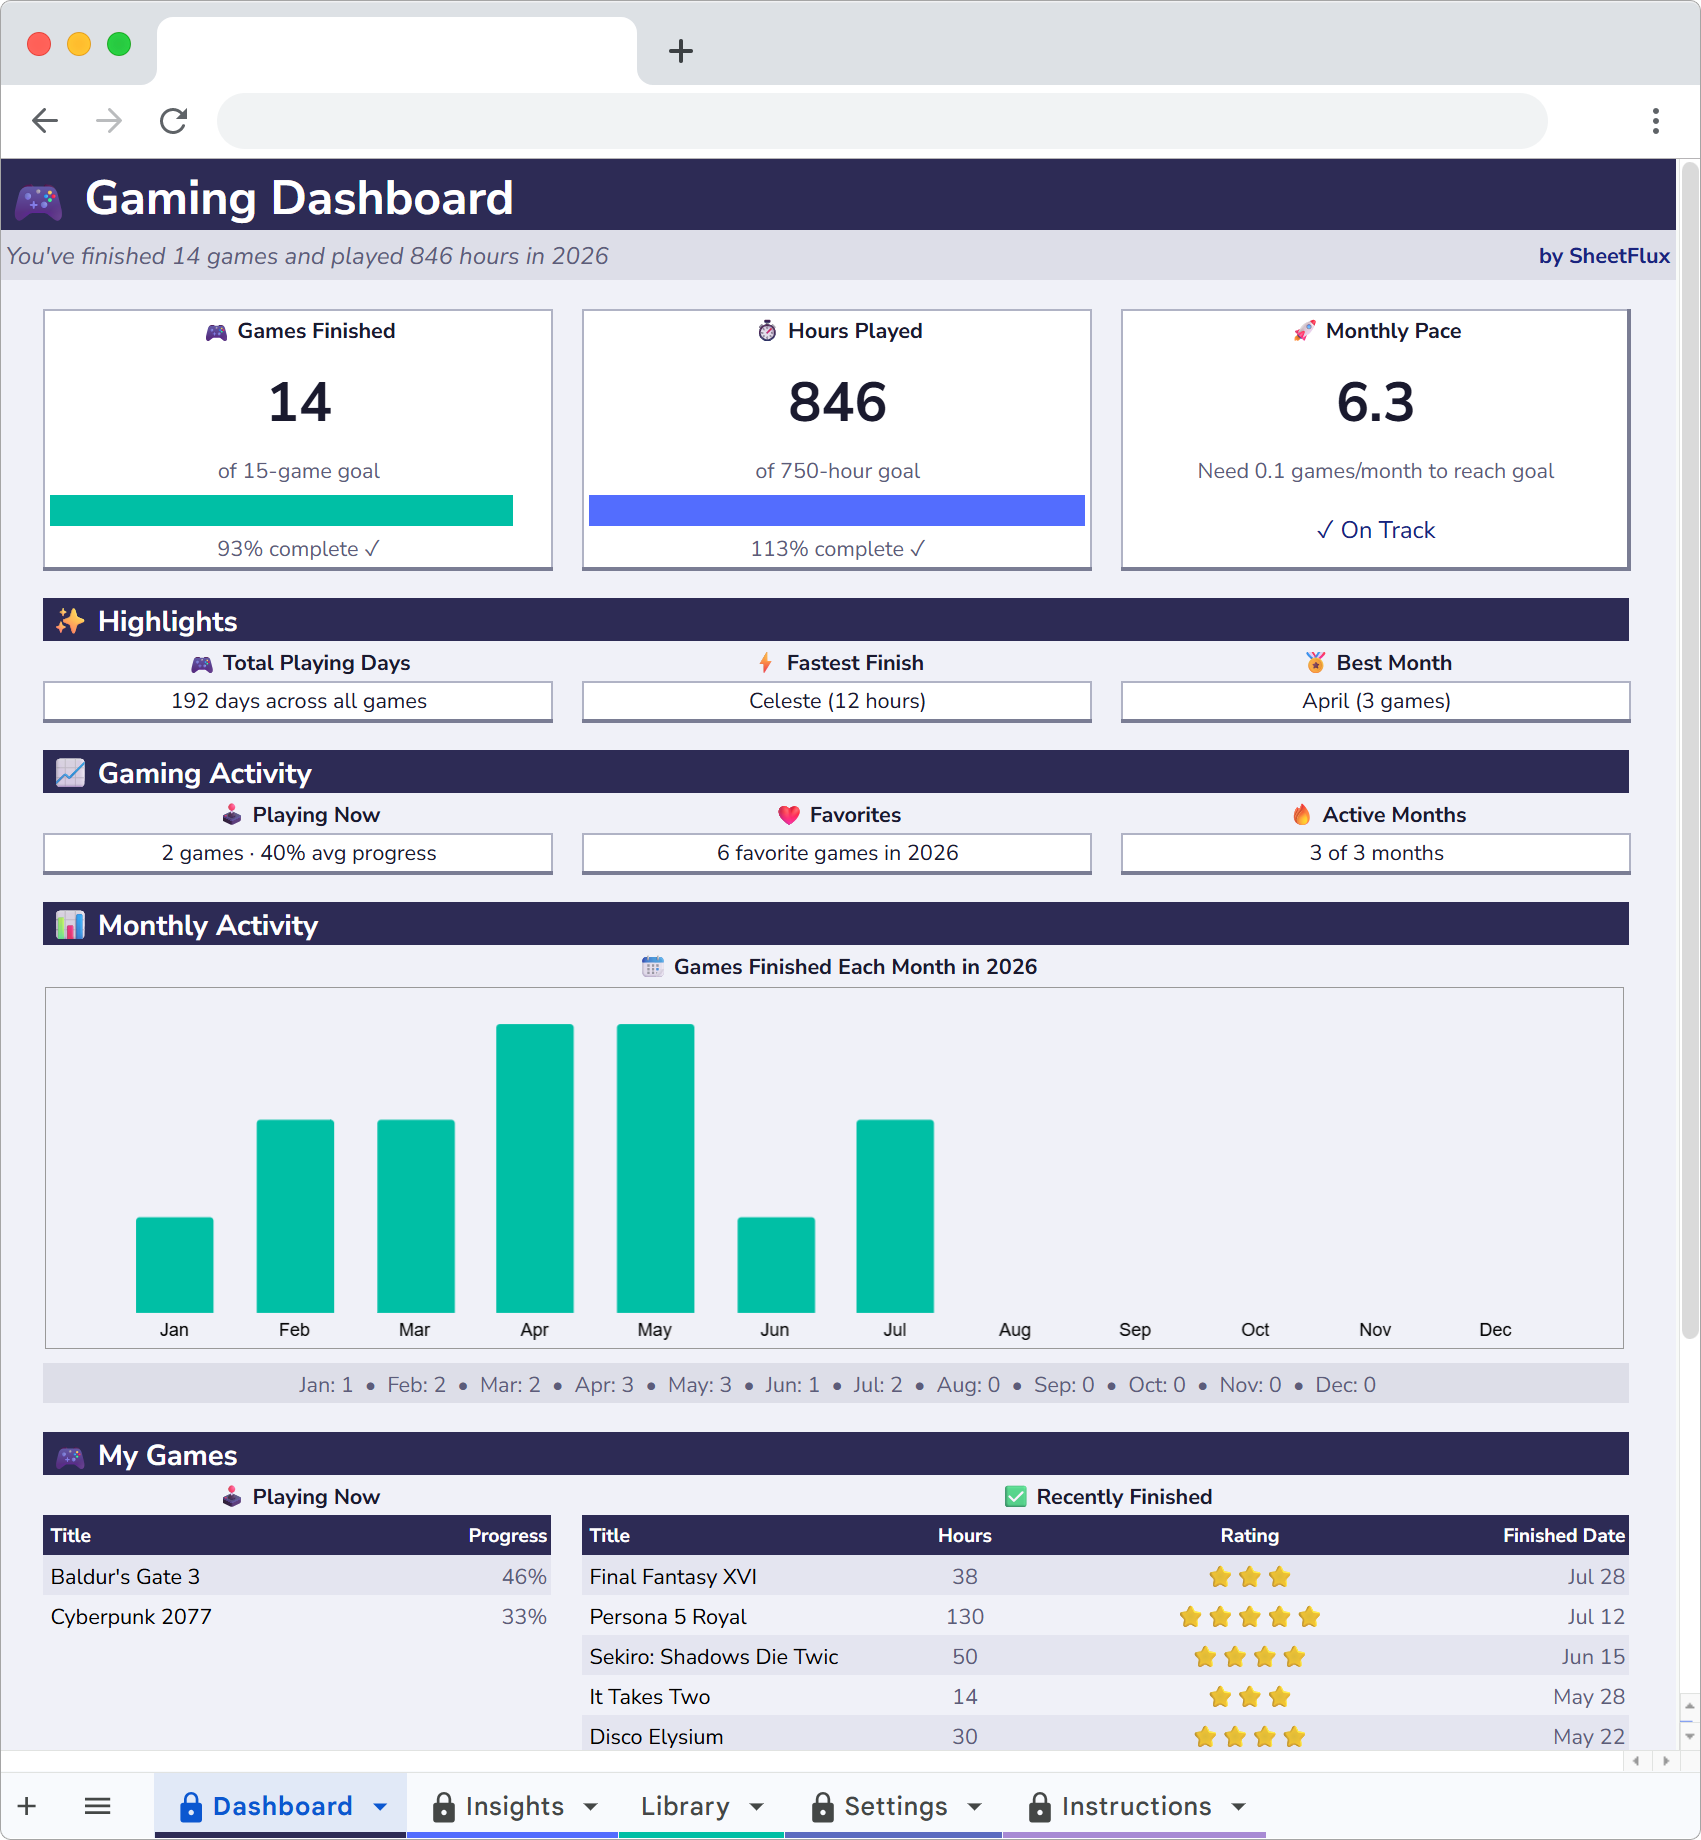
The backlog countdown
The dashboard has a backlog counter. Mine started at 187. Every time I finish a game or decide to drop one, the number goes down.
It's more motivating than I expected. I stopped buying new games for two months just to see the number drop faster. It went from 187 to 164 in that stretch. Not because I rushed through games, but because I also dropped about a dozen titles I knew I was never going to play. Being honest about that felt good.
The counter also shows your completion rate as a percentage. Going from 14% to 19% doesn't sound like much, but when you watch it tick up week after week, it adds up.
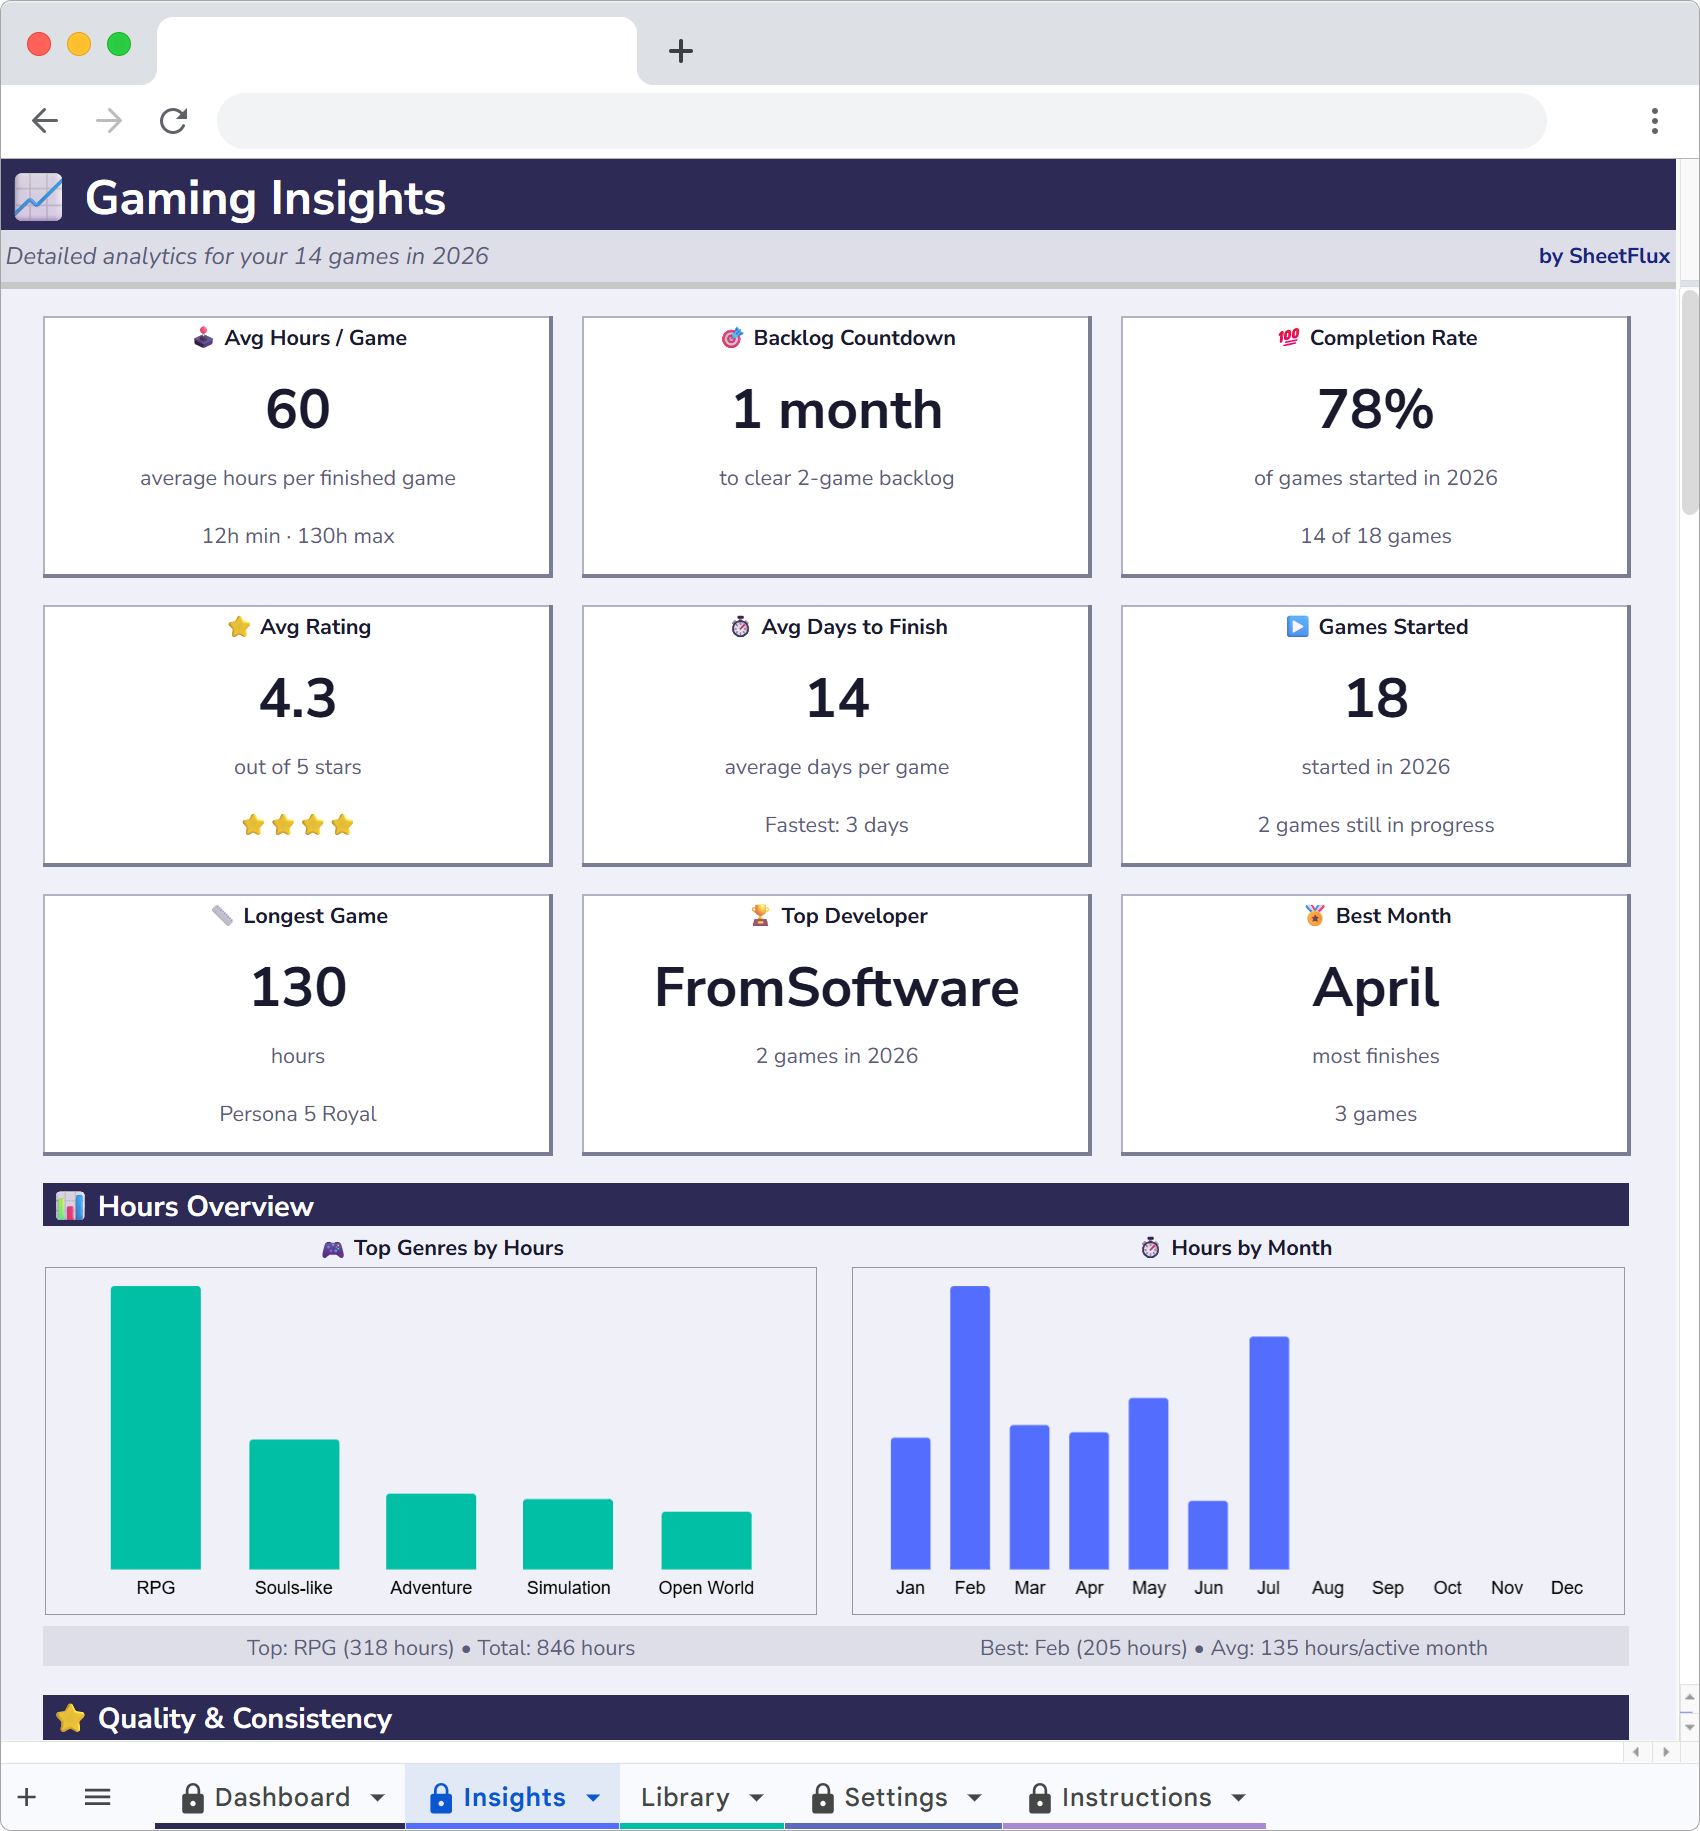
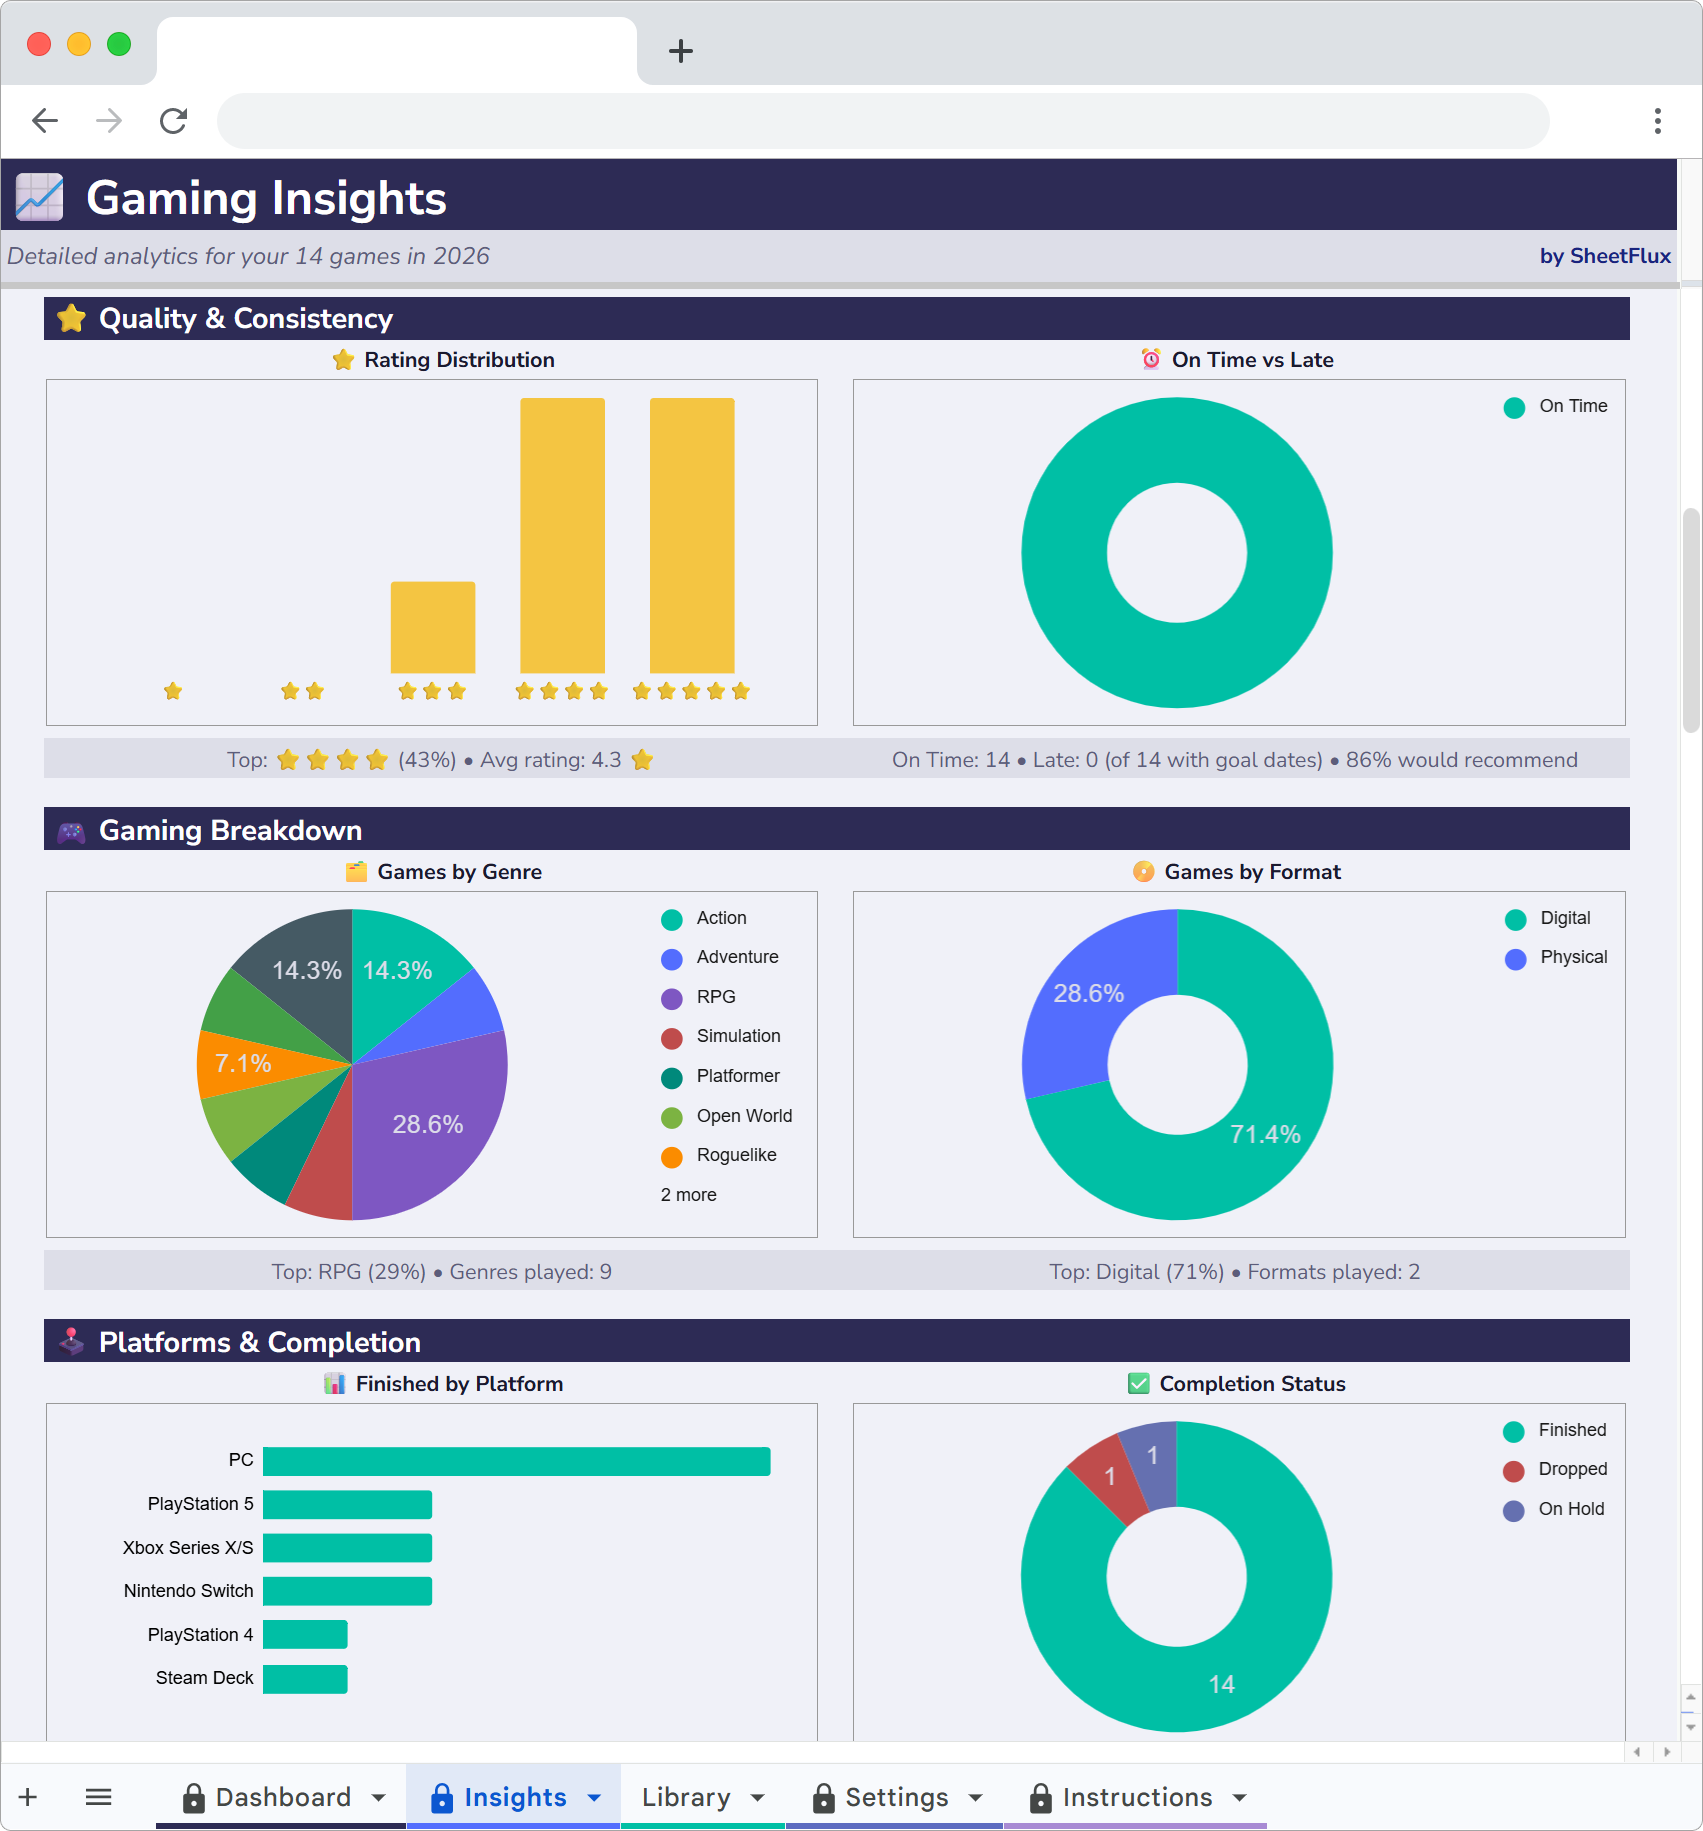
Genre and platform breakdowns
This is where things got interesting. The charts showed me that 60% of my purchases are PC games, but I play console games more often. I buy PC games on Steam sales because they're cheap. Then I sit on the couch and play my PS5 instead.
Genre breakdown was revealing too. I own 31 RPGs. I've finished 8 of them. That's a 26% completion rate for RPGs. Meanwhile, my indie puzzle games have a 70% completion rate because they take 4 to 6 hours instead of 80.
The data made the obvious thing visible: I like starting RPGs more than I like finishing them. Knowing that, I stopped buying every RPG that gets good reviews and got more selective.
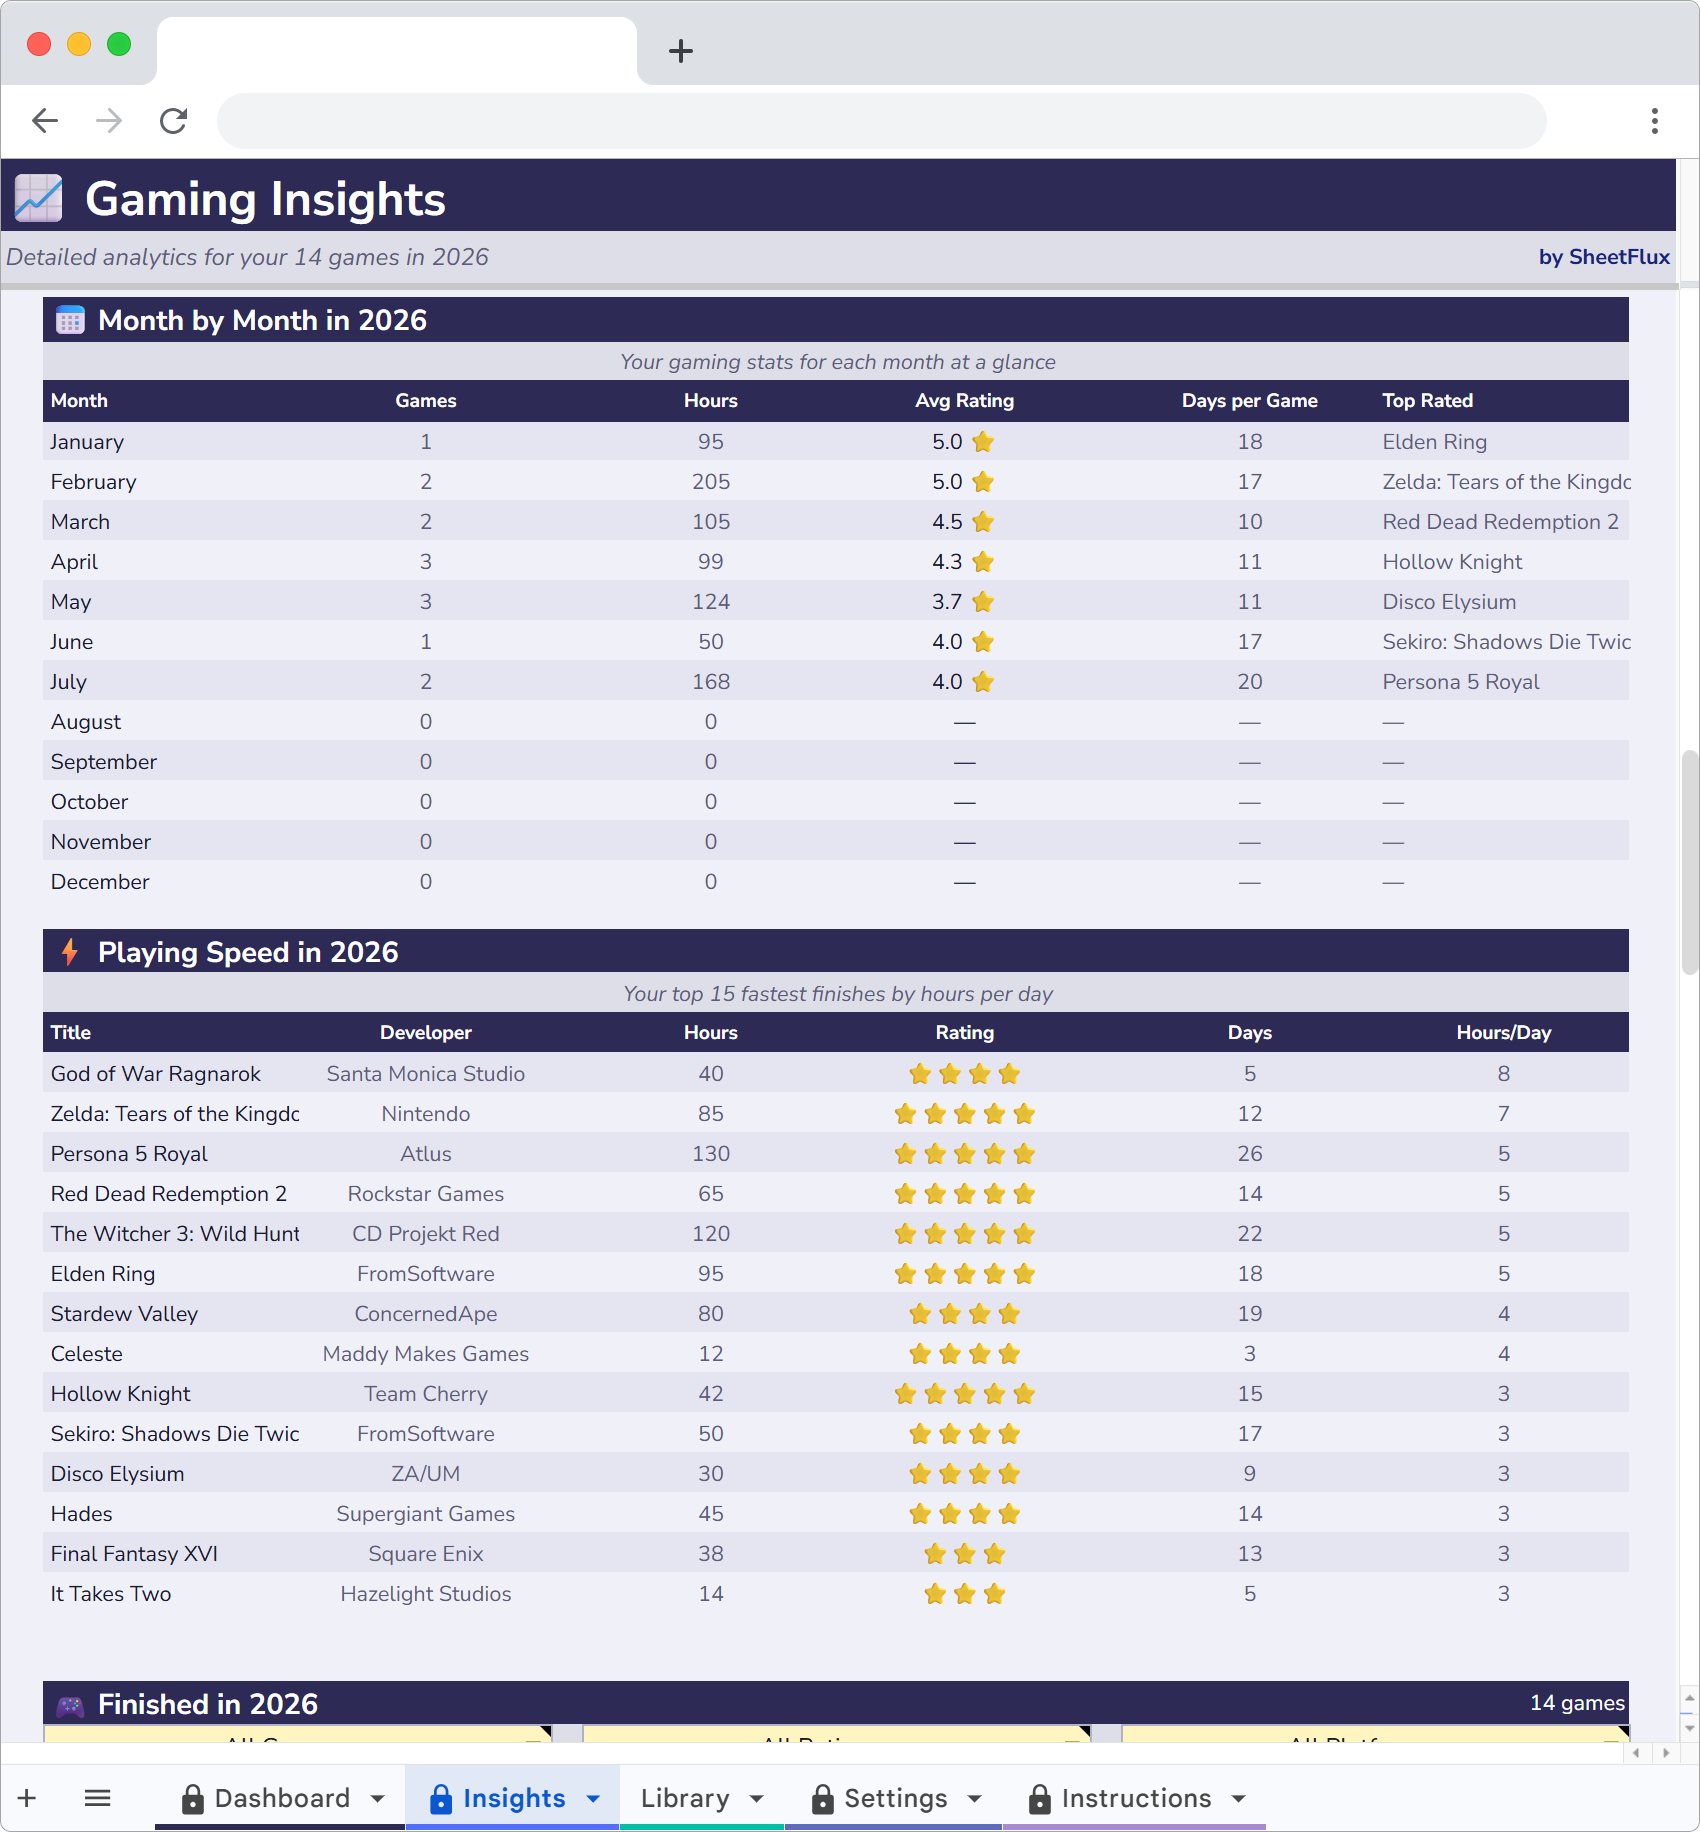
Monthly trends
I finish more games in January and February than any other months. Summer is dead. I thought it would be the opposite, but summer has better weather, more social plans and longer days. Winter is when I actually sit down and play through a 40-hour game.
Knowing my own patterns helps me plan. I don't buy big releases in June anymore. They'll just sit in the backlog until November.
Cost per hour
This metric changed my perspective on game purchases. Elden Ring cost me $60 and I played it for 94 hours. That's $0.64 per hour. A $20 indie game I played for 2 hours cost me $10 per hour.
Some people hate reducing games to a cost calculation. Fair enough. But when you're looking at a $70 purchase and you know from your own data that you finish about one in four RPGs, the math is useful. That $70 game has an expected cost of $280 per completion if you're being honest about your track record.
I still buy games I'm excited about. But I buy fewer of them, and I actually play the ones I buy.
Backloggd for discovery, spreadsheet for reality
I still check Backloggd to see what people think about games. I still check HowLongToBeat to know what I'm getting into before I buy something. Those tools are good at what they do.
But neither of them gives me the full picture. Neither tells me how much I spent, how many hours I actually played, which platforms I use the most or how my backlog has changed over time. The spreadsheet does all of that, and it took me about ten minutes to set up.
My backlog is at 158 now. Still too many games. But at least I know exactly how many, what they cost me and which ones I'm probably never going to touch.
Get your backlog under control
PlayFlux is a Google Sheets game tracker with backlog countdown, spending analytics and completion stats. 20 sample games included.
More articles
- Why I Ditched Goodreads for a Spreadsheet
- Letterboxd Is Great but It Can't Do This
- Why I Quit Untappd and Track Beer in Google Sheets
- I Left Ravelry and Track My Projects in a Spreadsheet Now
- Why I Started Logging Every Drawing I Make
- How I Finally Started Finishing Craft Projects
- How I Track My Comic Collection Without Losing My Mind
- How I Track Every Movie and Show I Watch
- I Tracked Every Book I Read for a Year
- How I Track My Online Courses in Google Sheets
- How to Track Every Concert You Go To
- Why I Track Every Album I Listen To
- How I Finally Got My Gaming Backlog Under Control
- How I Track Everything I Watch, Read and Play in Google Sheets
- Google Sheets vs Notion for Tracking Hobbies
- How to Build a Year-in-Review Dashboard for Your Hobbies
- The Board Gamer's Guide to Tracking Cost Per Play
- Why I Stopped Using Vivino and Started Tracking Wine in a Spreadsheet