Why I Ditched Goodreads for a Spreadsheet
I had 247 books on my Goodreads shelf. I know because I exported the CSV before deleting my account. Out of those 247, I'd rated maybe 180, reviewed about 30, and actually remembered rating most of them wrong. I gave Sapiens 4 stars in 2019. I'd give it 3 now. But Goodreads doesn't remind you to revisit old ratings. It just stacks them up like trophies.
The moment I decided to leave was smaller than that, though. I was looking for how many pages I'd read that year. Total pages. Goodreads tracks books, not pages. There's no reading speed data. No way to see that a 600-page novel and a 150-page novella both count as "1 book" and that maybe that's a terrible metric.
I wanted numbers. Goodreads gave me a social feed. That frustration is actually why I ended up building ReadFlux, a book tracker that lives entirely in Google Sheets — but more on that later.
What Goodreads does well
I'm not going to pretend Goodreads is useless. The database is massive. If you want to check whether a book exists, read a few reviews before buying, or see what the average rating is, Goodreads is good at that. The Reading Challenge is a nice motivational nudge once a year. And the recommendation lists (the user-curated ones, not the algorithm) have given me genuinely good picks.
But that's discovery and shopping. It's not tracking.
What Goodreads can't do
Here's what I wanted that Goodreads doesn't offer:
- Page count analytics. How many pages did I read this month? This year? What's my average pages per day? Goodreads counts books. I wanted to count pages.
- Reading speed by genre. I read nonfiction about 3x slower than fiction. That changes how I plan my reading queue. Goodreads has no concept of this.
- Source tracking. Did I buy this book, borrow it from the library, or get it as a gift? I wanted to know what percentage of my books I actually paid for. (It was 62%. I finished only 41% of the ones I bought.)
- Format breakdown. Physical, ebook, audiobook. My audiobook ratings average half a star lower than physical books. I never would have noticed that without the data.
- Custom columns. On Goodreads, you get their fields. You can't add "recommended by" or "re-read" or "reading location" or anything else. The schema is fixed.
- Real export. The Goodreads CSV export is missing half the useful data. Dates are inconsistent. Some fields export blank even when you filled them in on the site.
And then there's the Amazon factor. Goodreads has been owned by Amazon since 2013. The recommendations lean toward books you can buy on Amazon. The "Want to Read" shelf is basically a shopping list with a Buy button attached. That's not a tracking tool. That's a storefront with a reading log bolted on.
What a spreadsheet gives you
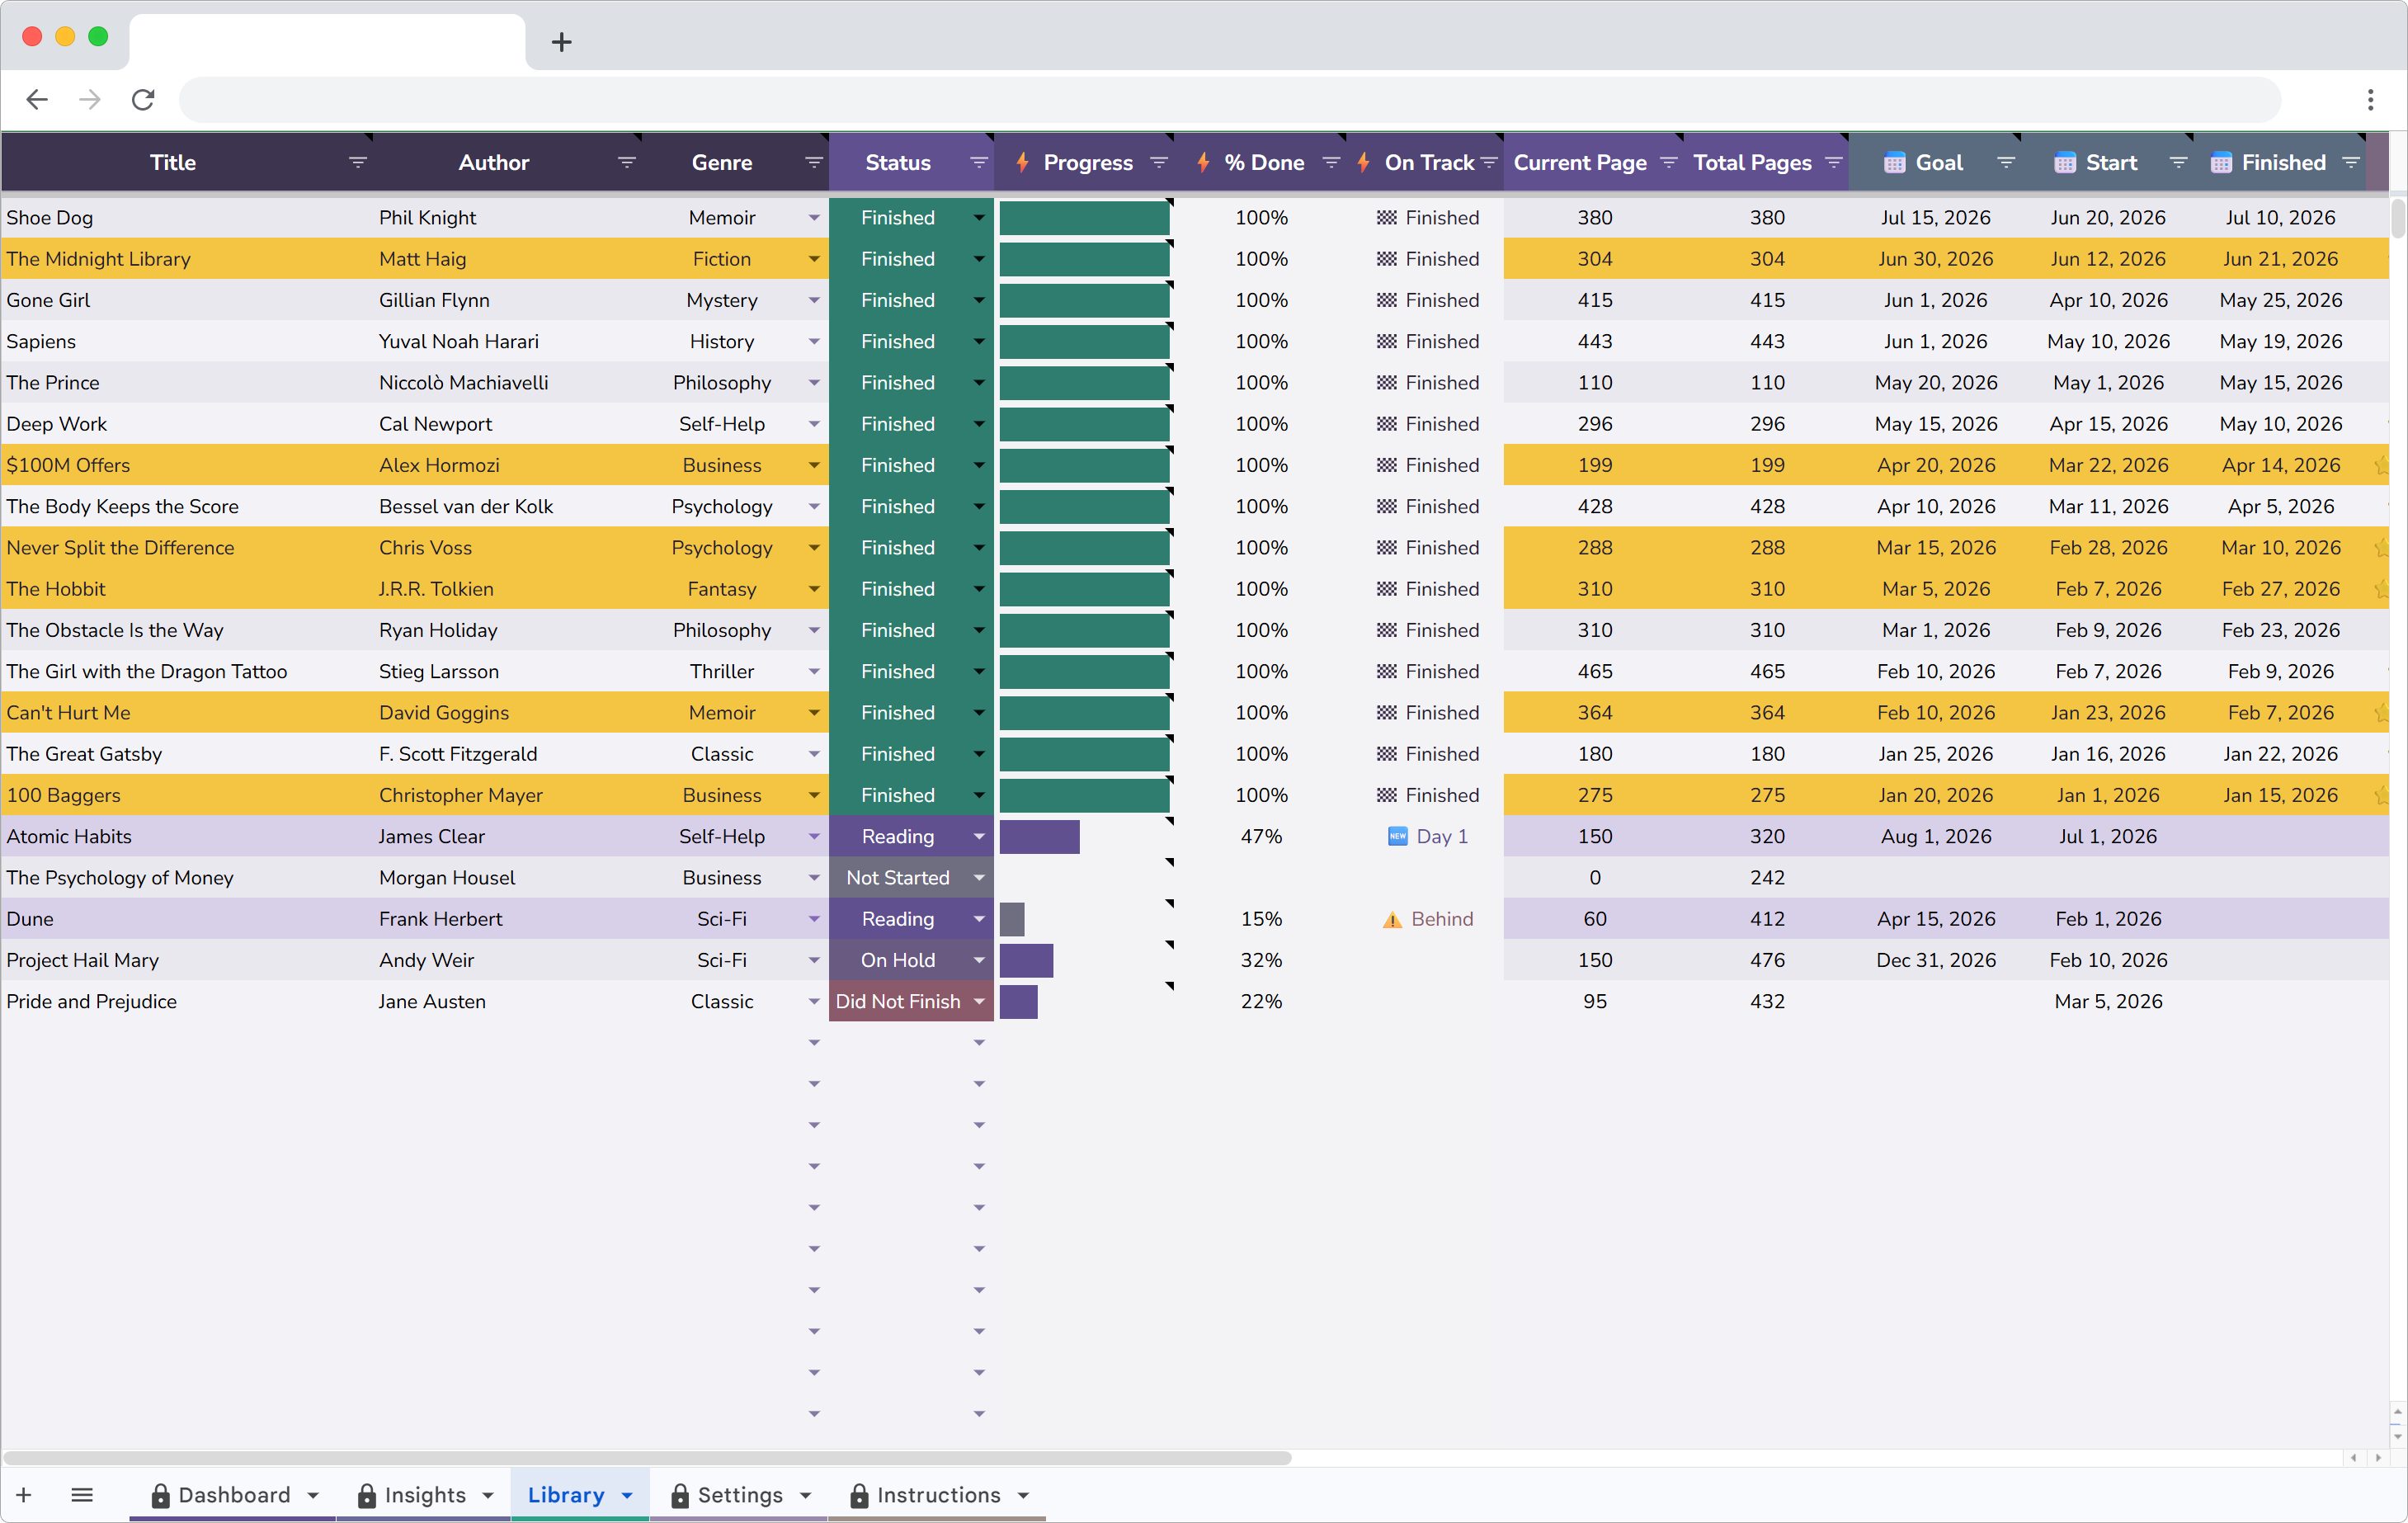
I switched to tracking in Google Sheets using ReadFlux. Each book gets one row with: title, author, genre, pages, dates started and finished, rating, status, source and format. Adding a book takes about 20 seconds.
The difference hit me within the first month. I could sort by pages and see which books actually took the most effort. I could filter by source and see that library books had a higher finish rate than purchased ones. I could look at my "Did Not Finish" list and notice that 5 out of 7 DNFs were impulse buys from airport bookstores.
The dashboard changed how I read
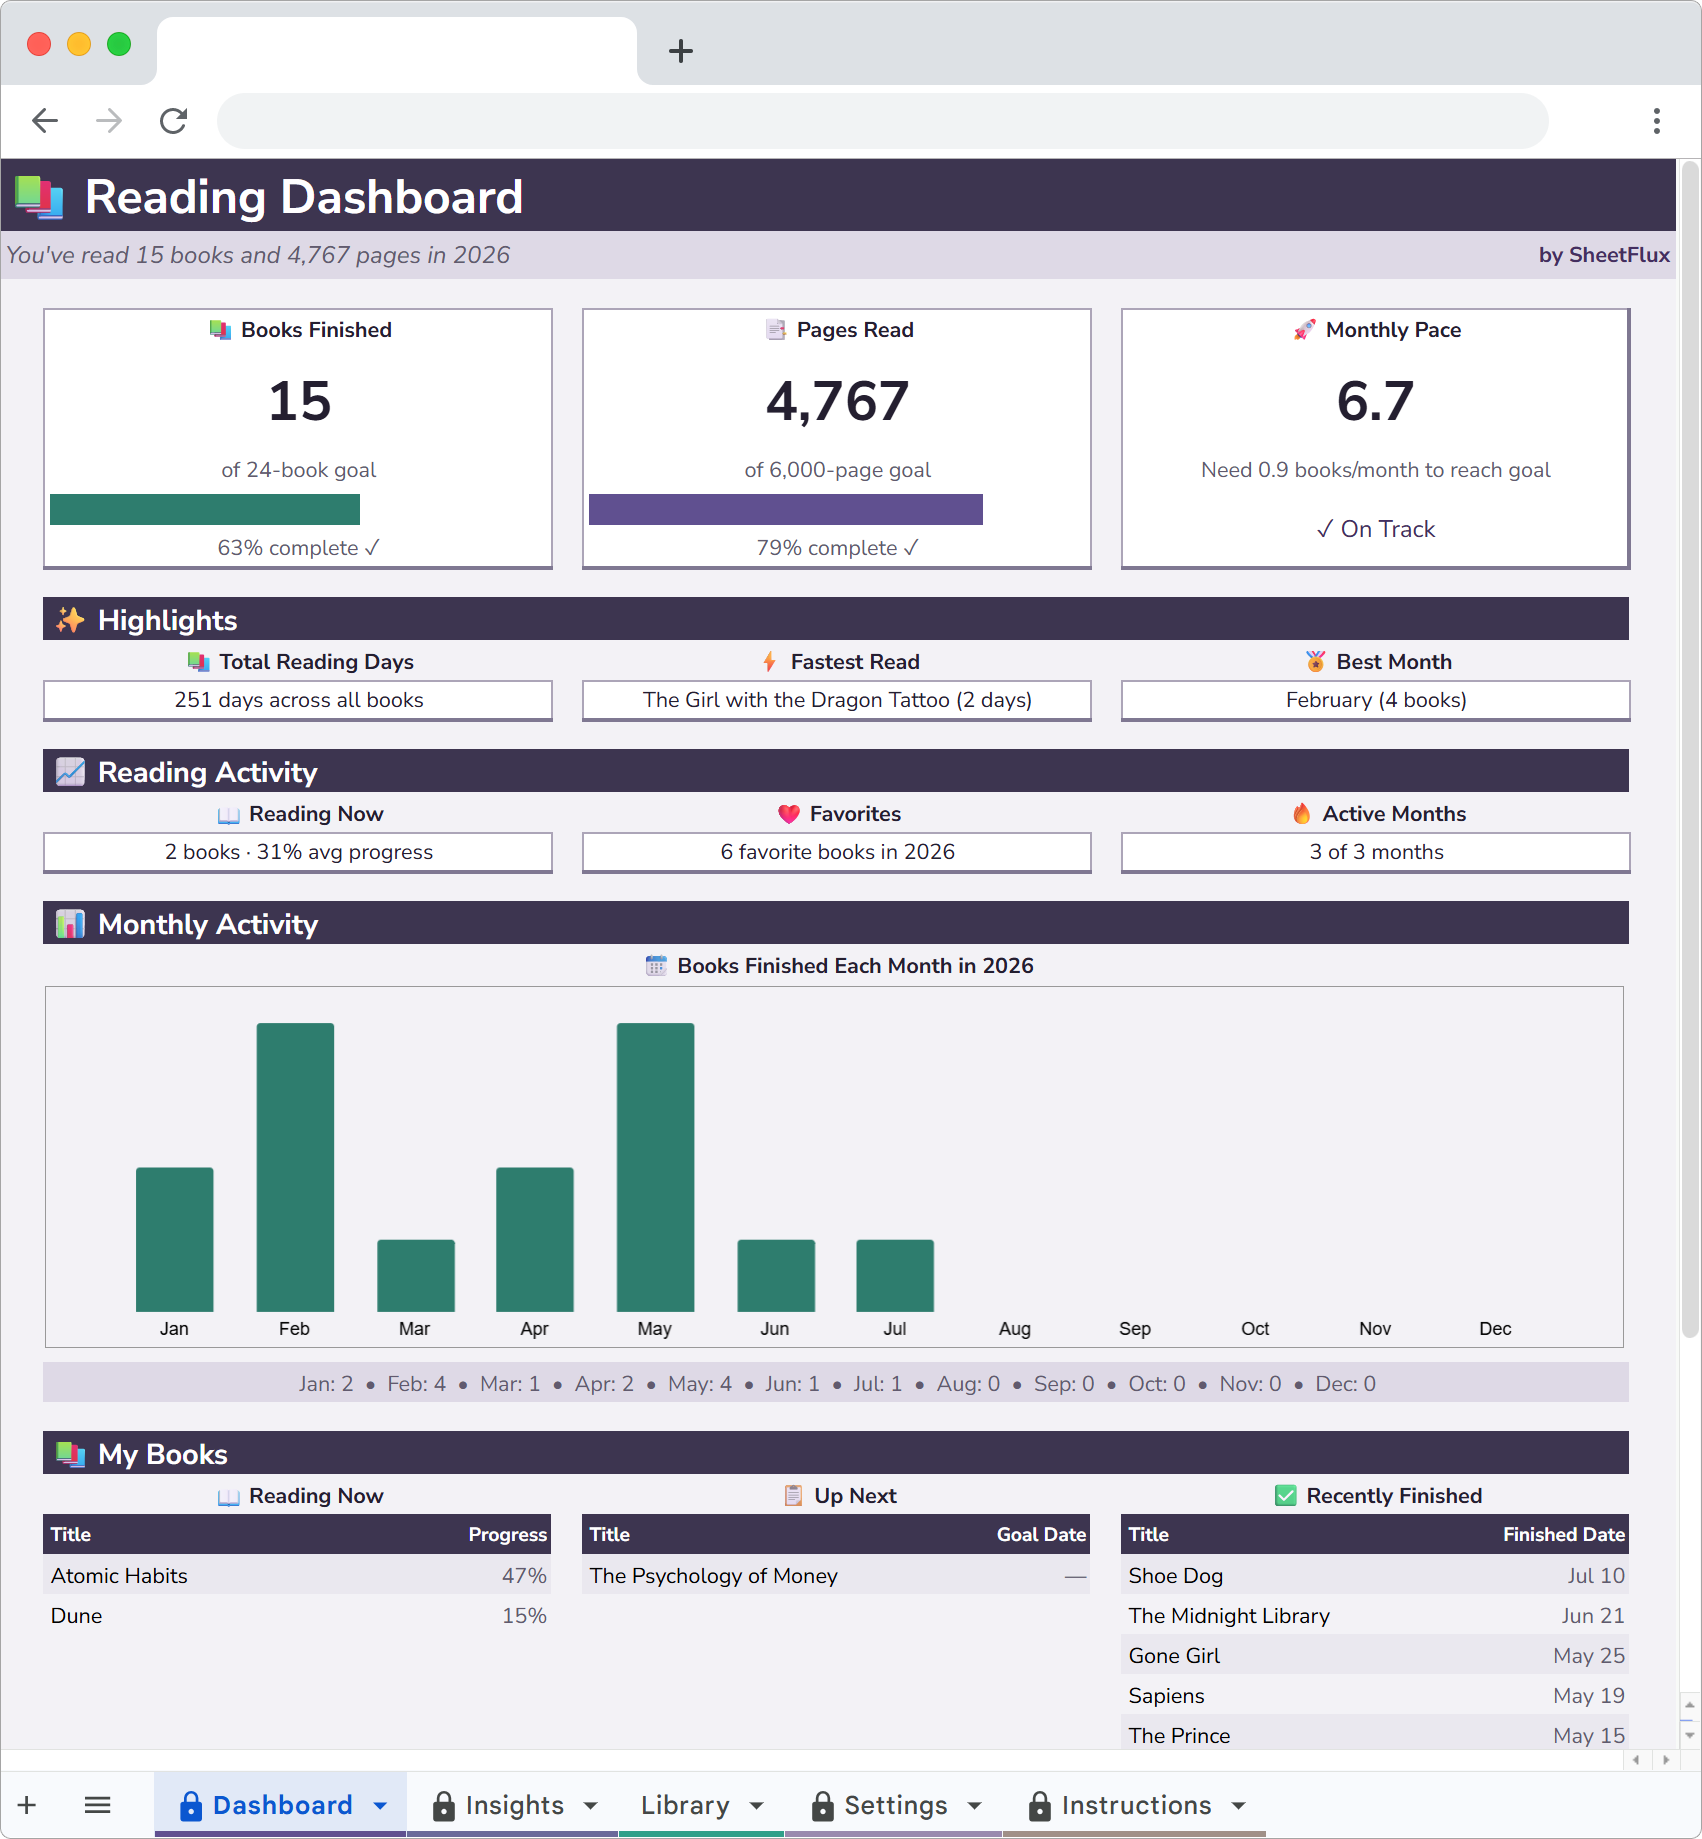
ReadFlux has a Dashboard that updates automatically. Books finished this year. Pages read. Average rating. Current pace toward my yearly goal. Monthly bar chart showing when I read the most.
Two things jumped out right away. First, I read almost nothing in June and July. Every year. Summer isn't my reading season and I'd never noticed the pattern. Second, my average rating was 3.8 out of 5. I thought I was pickier than that. Turns out I give almost everything a 4.
Goodreads has a yearly challenge counter, but it's just a number and a progress bar. No monthly breakdown. No pace calculation. No way to see if you're frontloading your reading in January and coasting the rest of the year (I was).
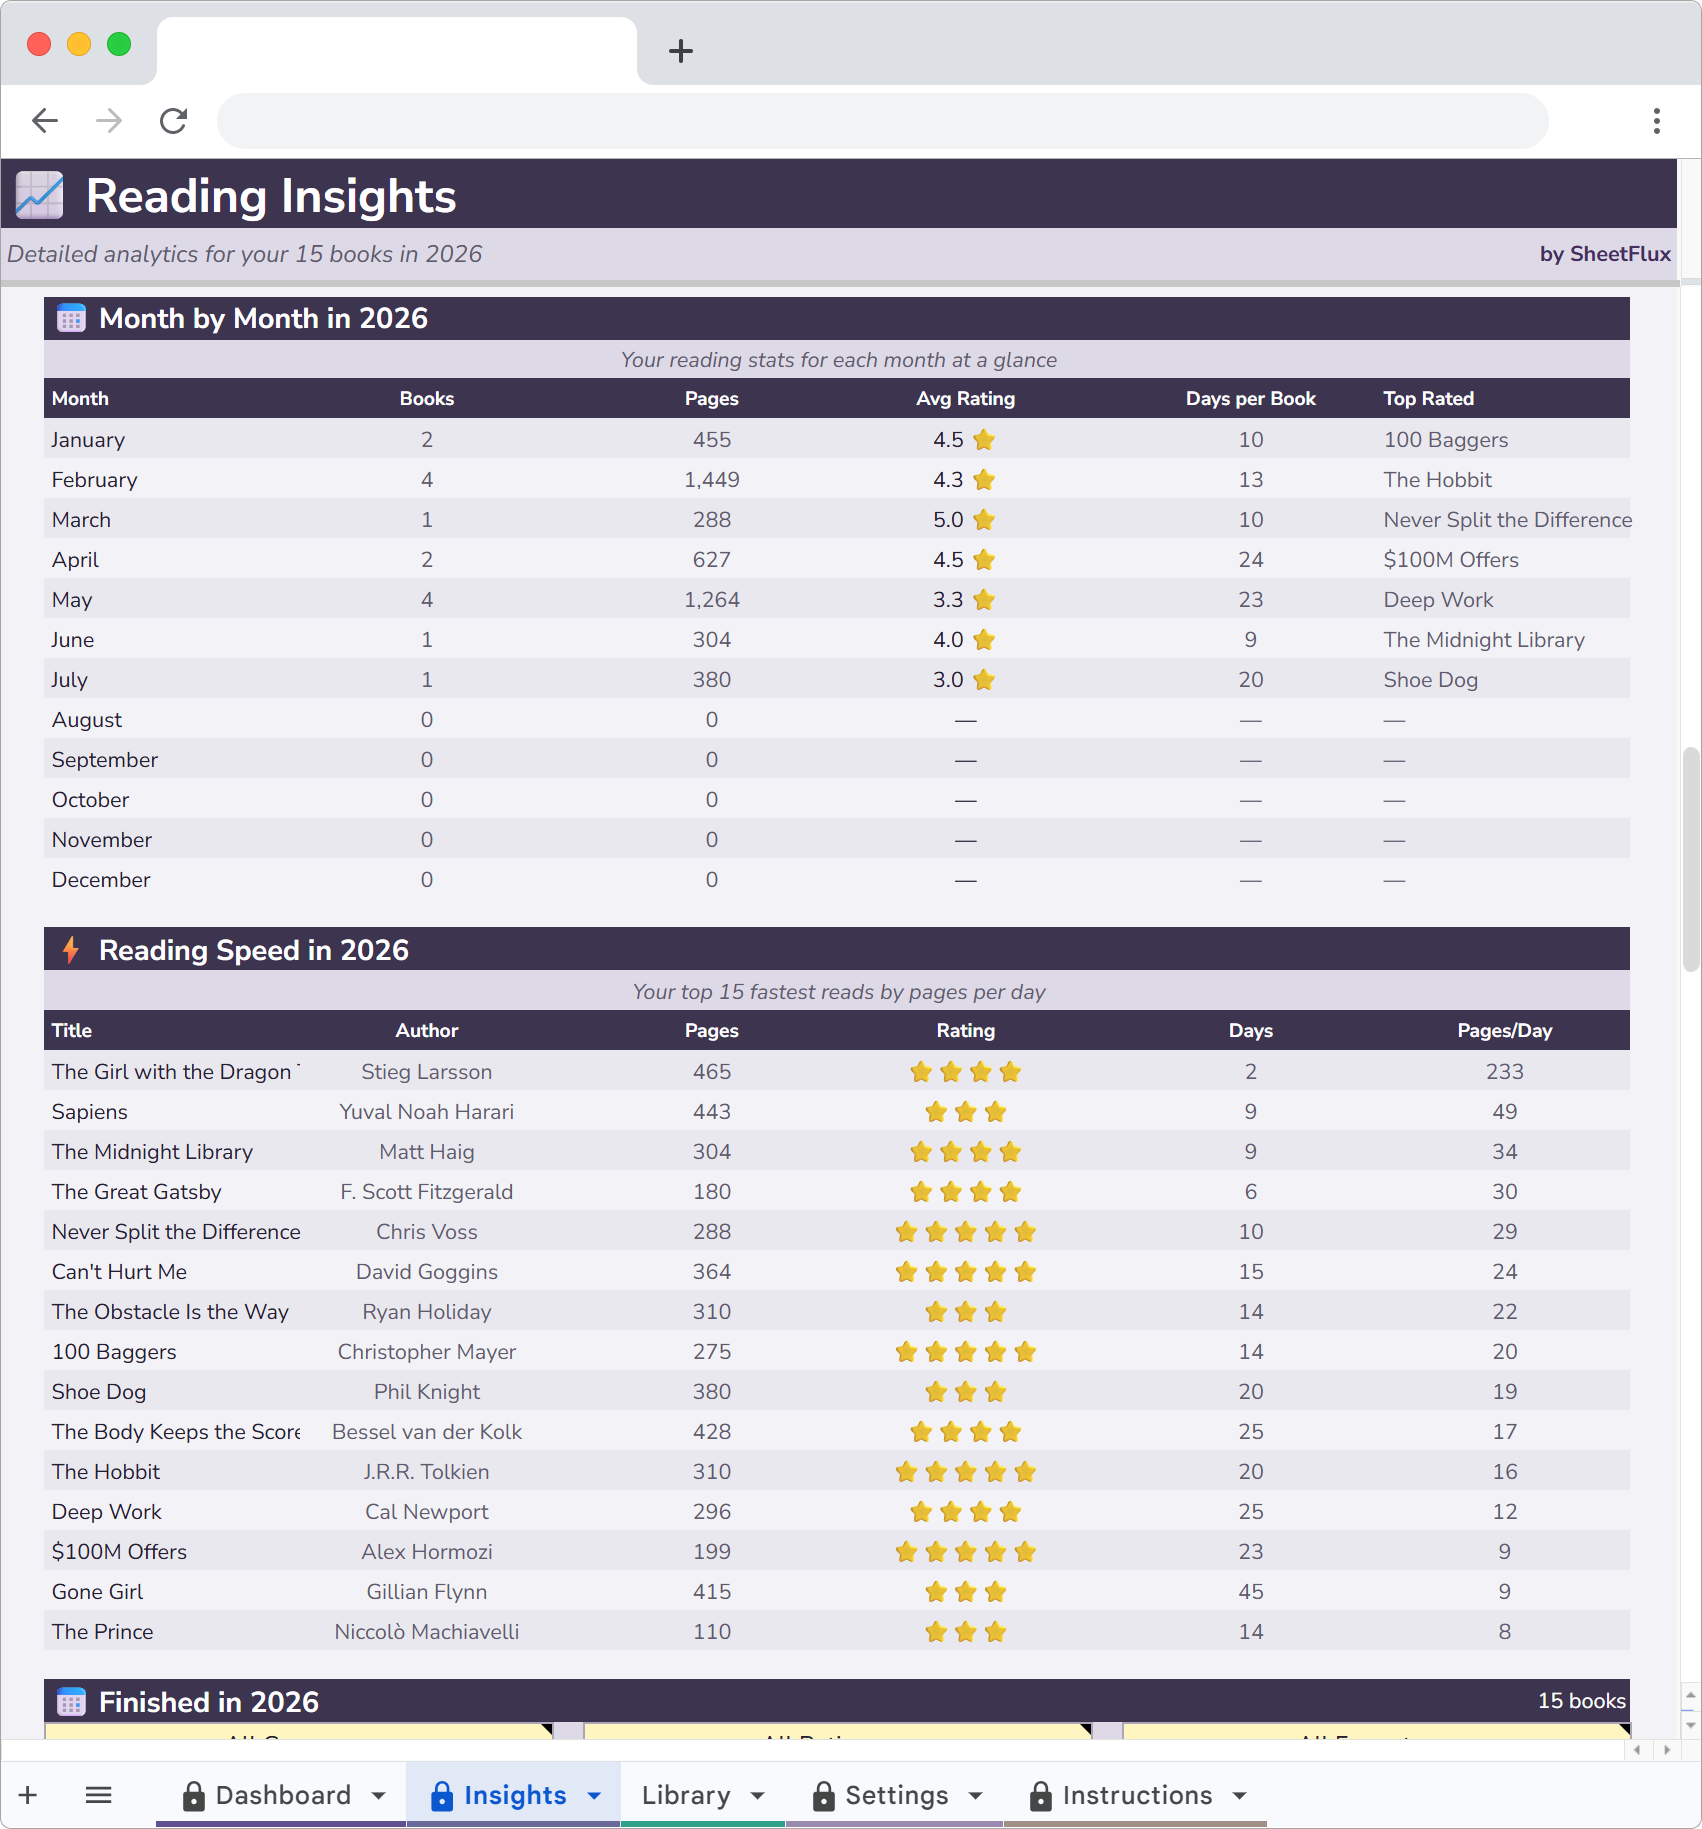
Genre and rating breakdowns
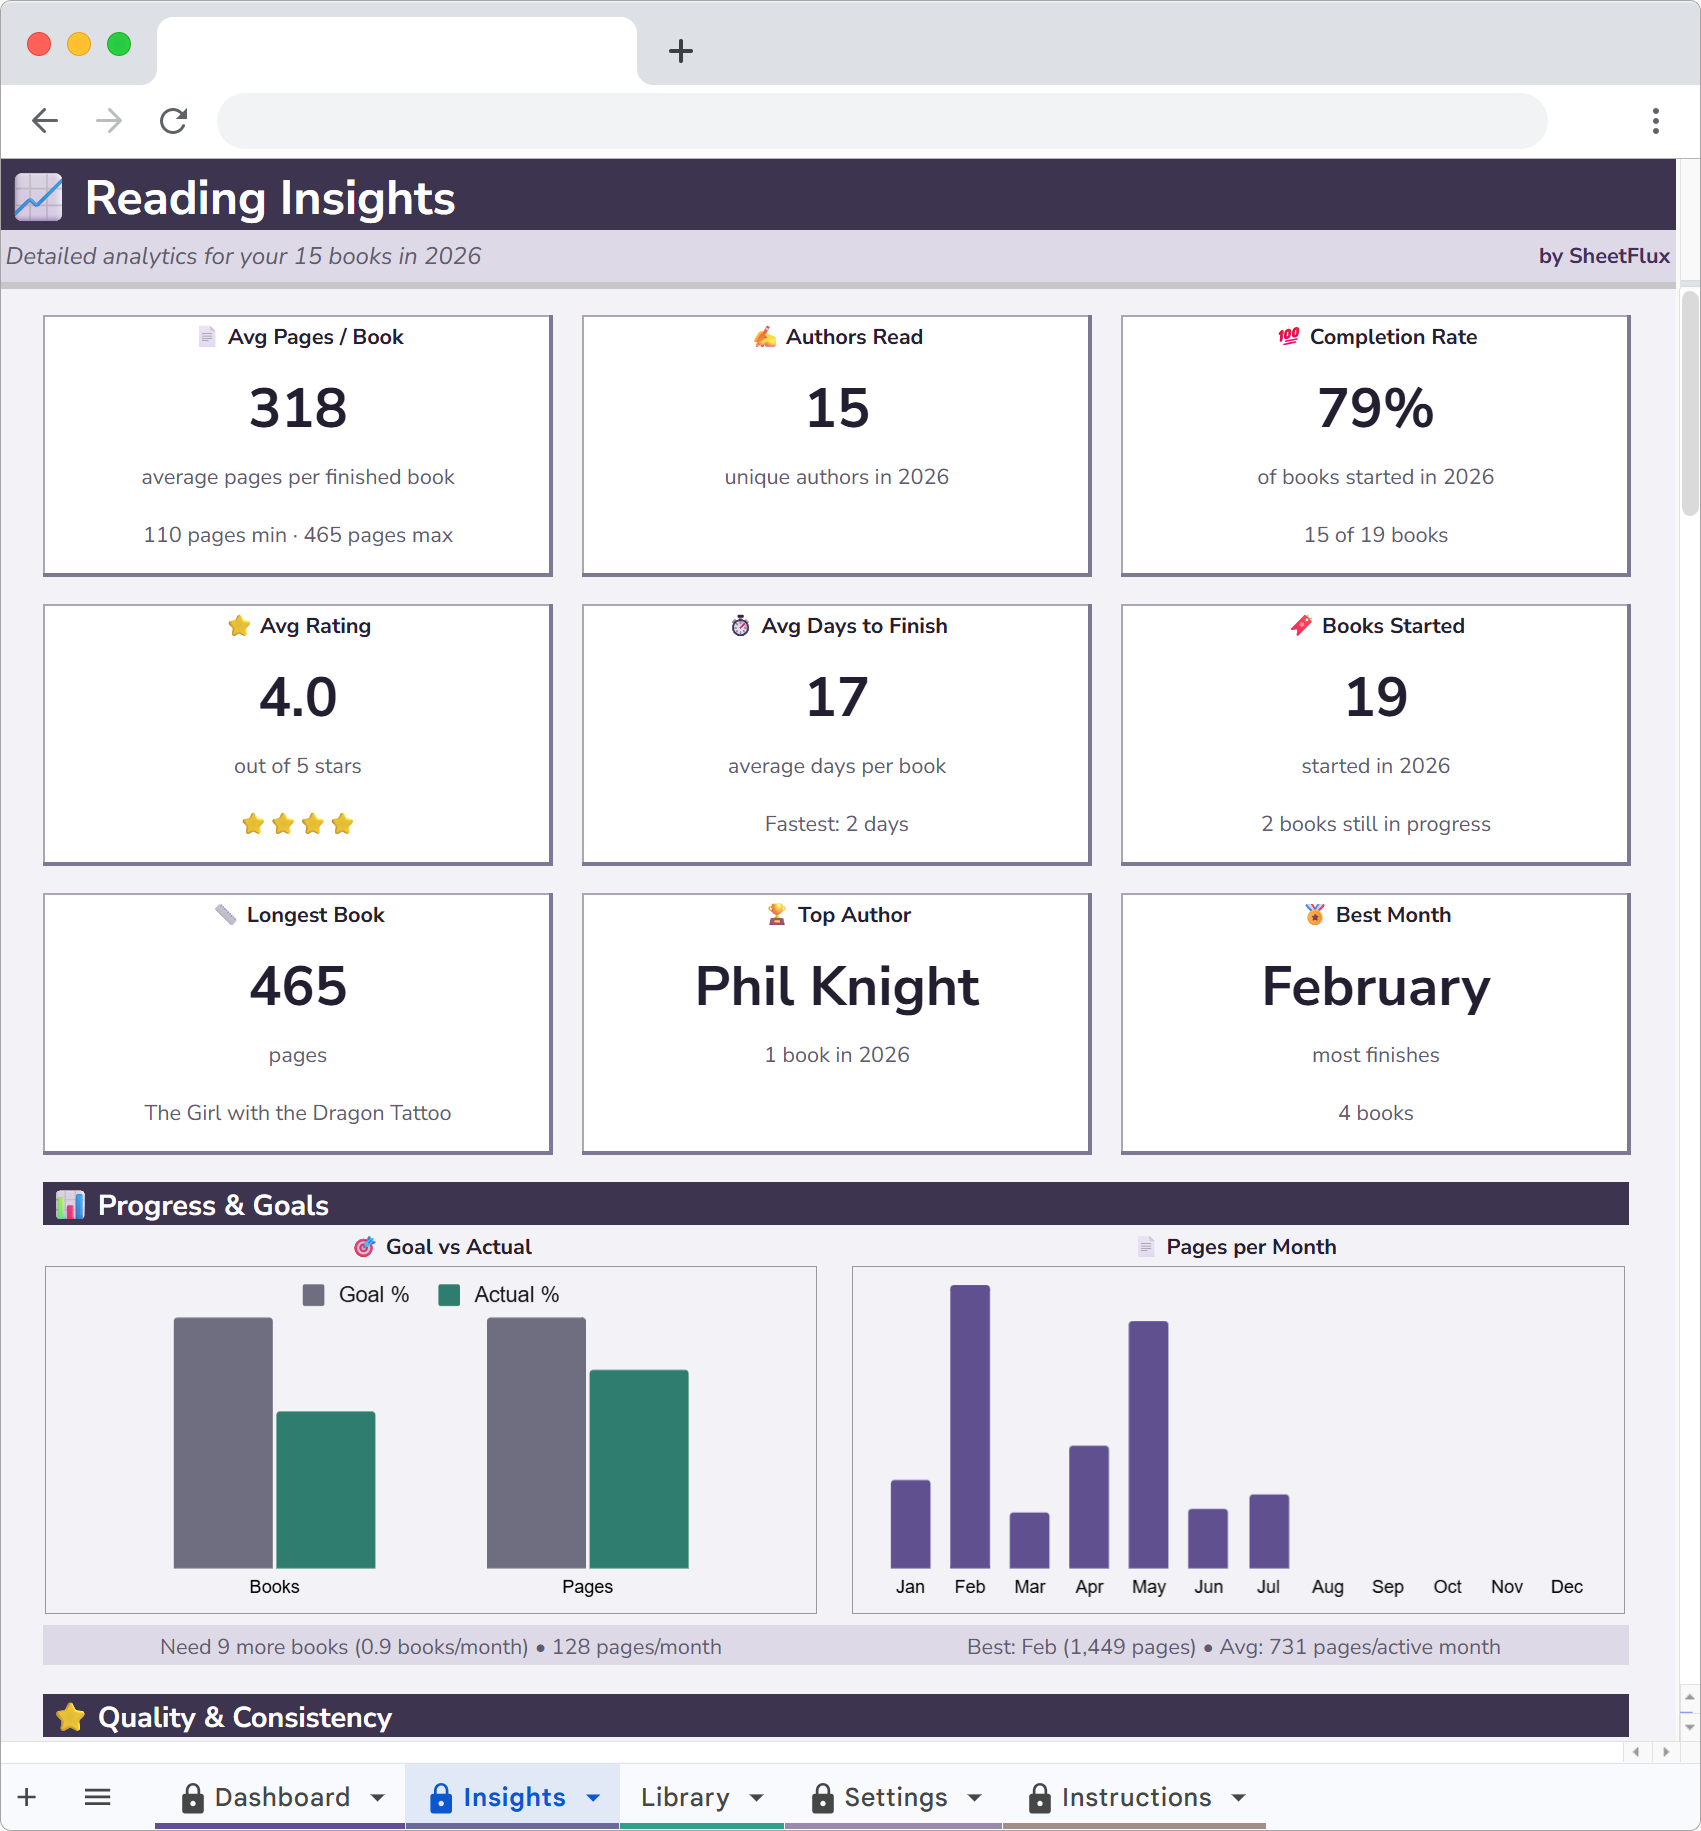
The Insights page has charts I actually look at. Genre distribution as a pie chart. Rating distribution as a histogram. Both update as I add books.
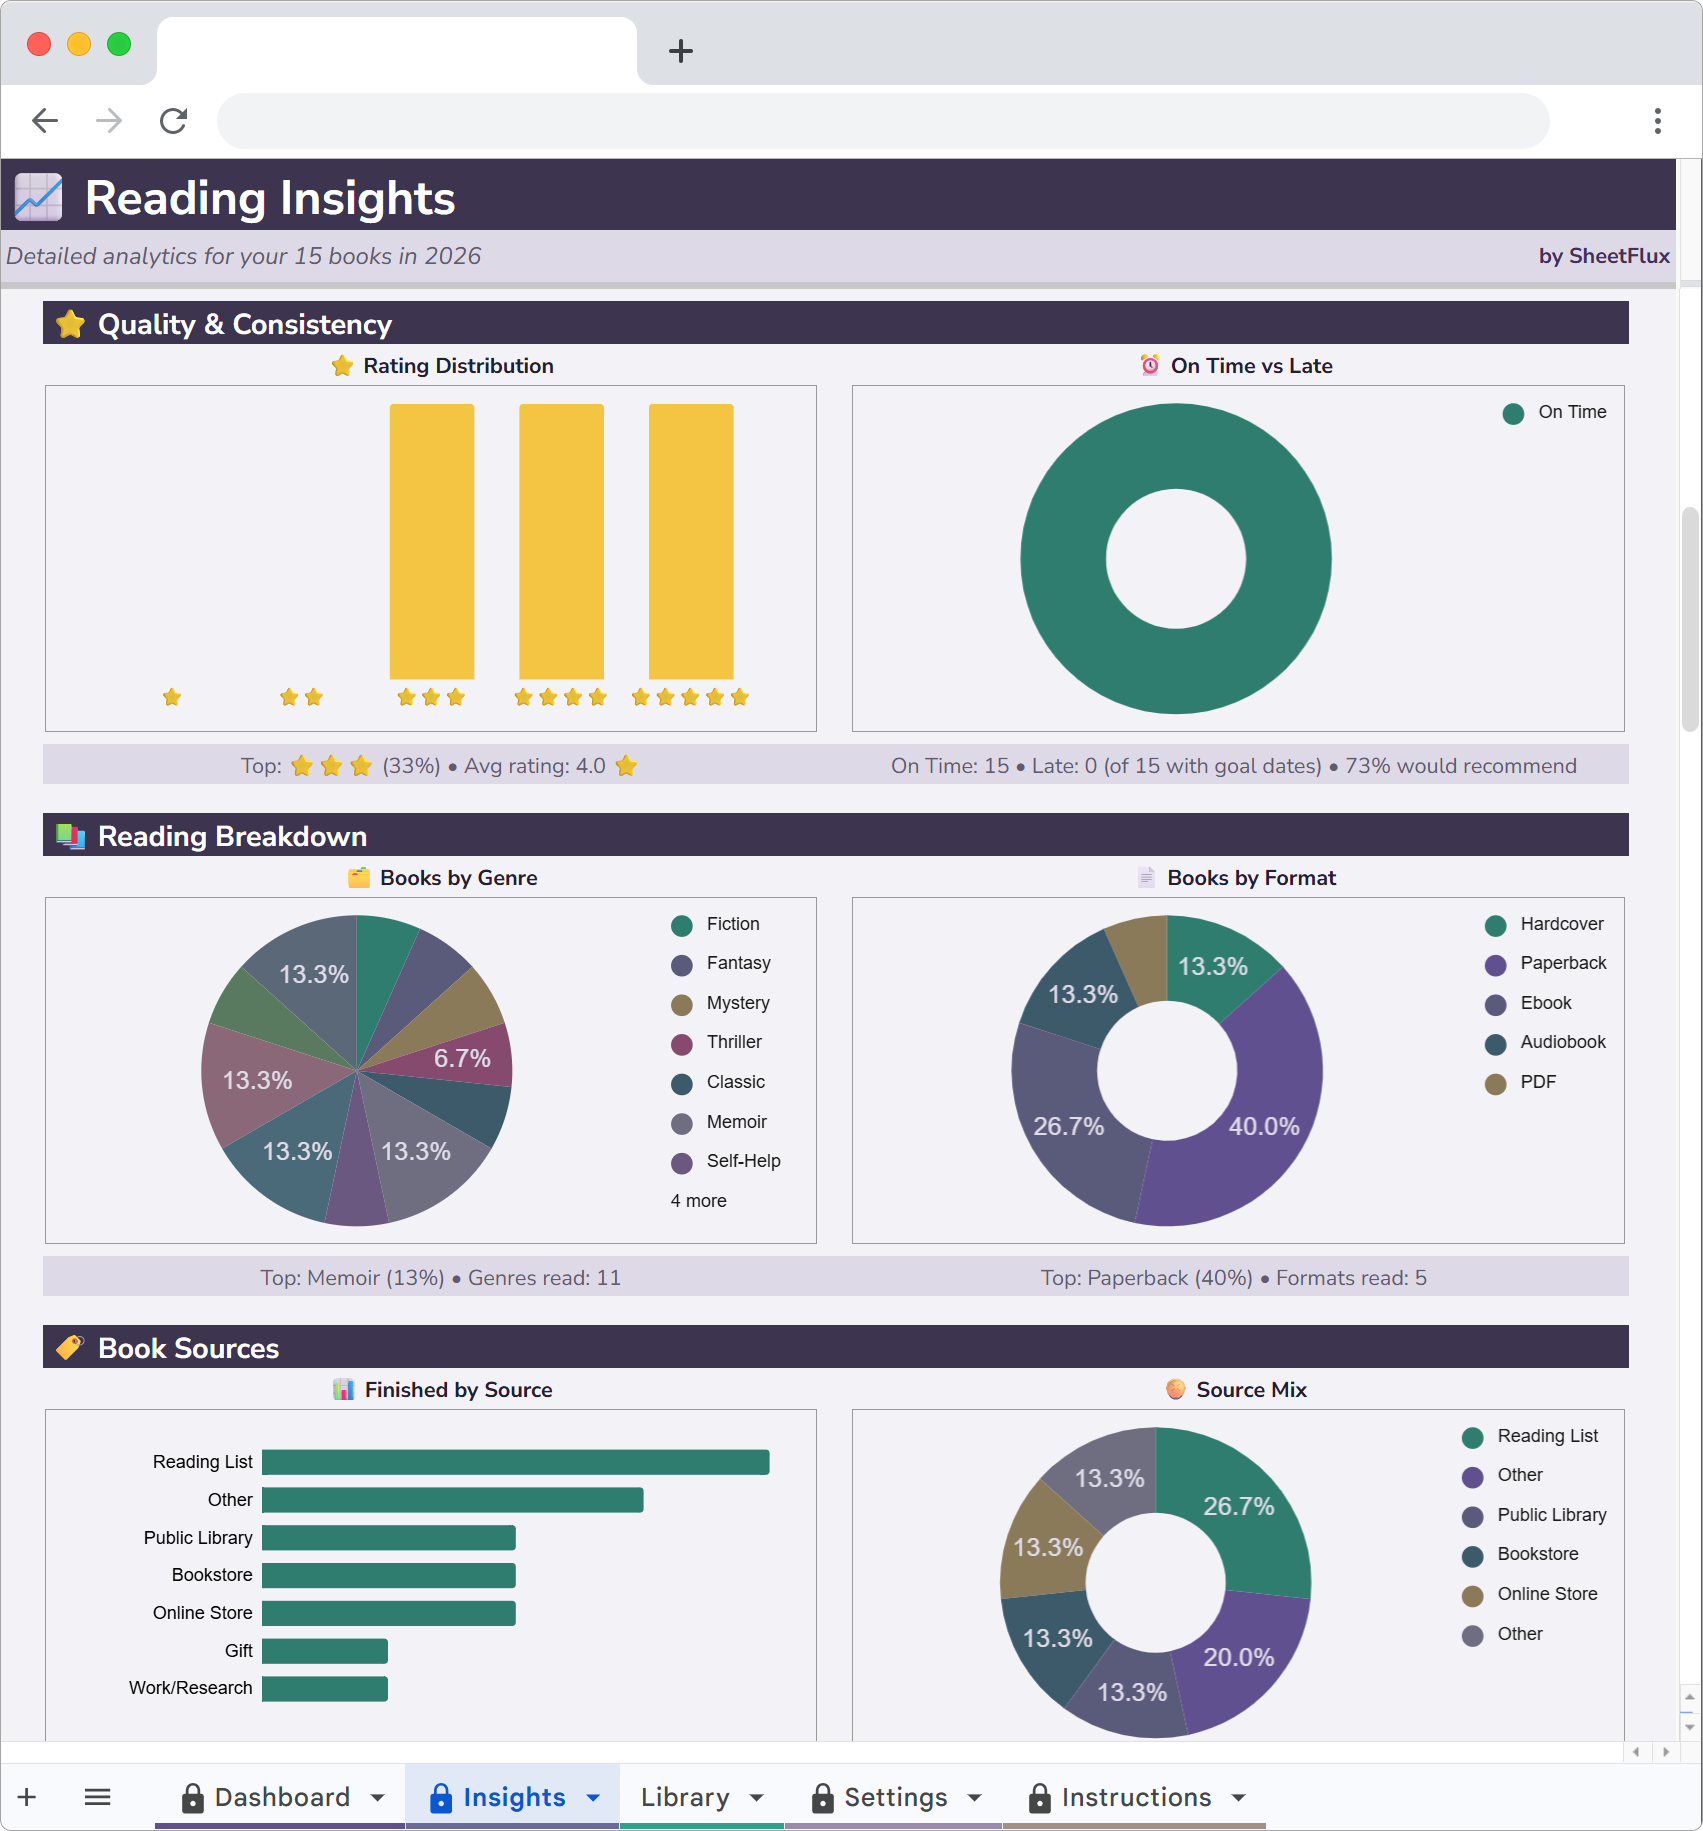
Last year's genre split: 55% nonfiction, 25% literary fiction, 12% sci-fi, 8% memoir. I thought sci-fi would be higher. It wasn't. I just remember the sci-fi books more vividly because they were more fun, which made me overestimate how many I'd read.
The rating histogram showed me something else. I gave thirteen books a 4, nine books a 5, six books a 3, and only two books below that. My ratings are compressed into a tiny range. Knowing that makes each rating more deliberate now.
Monthly trends and reading pace
There's a monthly activity chart that shows how many books I finished each month. Overlaid with that is a cumulative pace line showing whether I'm ahead or behind my yearly goal.
I set a goal of 30 books for last year. By April I was at 12, ahead of pace. Then the summer slump hit and I fell behind. I finished the year at 31. The chart showed me the exact shape of my reading year in a way Goodreads never could. Goodreads just says "31 of 30" with a green checkmark. The chart shows the whole story.
Source and format data
This is the data Goodreads literally cannot track because the fields don't exist.
I tagged every book with where it came from: bought, library, gift, or borrowed. And which format: physical, ebook, audiobook. The results were useful. Library books had a 90% finish rate. Bought books had a 65% finish rate. Gifts were at 50%. Turns out spending money on a book doesn't make me more likely to finish it. If anything, free books (library, borrowed) had higher completion rates because I picked them more carefully.
Format data showed that audiobooks averaged 3.6 stars while physical books averaged 4.1. Same types of books, different experience. I now save audiobooks for lighter reads and use physical copies for anything I want to retain.
Why Google Sheets specifically
Three reasons. First, I already use Google Sheets for other things, so there's no new app to learn. Second, it works on my phone through the Sheets app, so I can add a book from my couch. Third, the data is mine. It lives in my Google Drive. No company can shut down a service and take my reading history with it.
There's also a practical benefit: it's free to use. The template costs money, but the platform itself costs nothing. No subscriptions. No premium tier to unlock the charts.
I still use Goodreads for one thing
When I'm in a bookstore and I pick up something I haven't heard of, I check the Goodreads rating on my phone. If it's below 3.5 with over 1,000 ratings, I put it back. If it's above 4.0, I read the top negative review to see what people didn't like. That usually tells me more than the positive reviews.
That's a discovery use case. Goodreads is good at that. It's a book database with community ratings. For that purpose, it works fine.
But for tracking what I've read, how fast I read it, what genres I lean toward, how much I spend and whether I'm meeting my goals? Goodreads doesn't do any of that. A spreadsheet does all of it.
Goodreads is a social network for readers. A spreadsheet is a personal analytics tool for reading. They solve different problems. I needed the analytics.
Start tracking your reading
ReadFlux is a Google Sheets book tracker with reading analytics, genre charts and yearly goals. 20 sample books included so you can explore before adding your own.
More articles
- Letterboxd Is Great but It Can't Do This
- I Replaced My Gaming Backlog App with a Spreadsheet
- Why I Quit Untappd and Track Beer in Google Sheets
- I Left Ravelry and Track My Projects in a Spreadsheet Now
- Why I Started Logging Every Drawing I Make
- How I Finally Started Finishing Craft Projects
- How I Track My Comic Collection Without Losing My Mind
- How I Track Every Movie and Show I Watch
- I Tracked Every Book I Read for a Year
- How I Track My Online Courses in Google Sheets
- How to Track Every Concert You Go To
- Why I Track Every Album I Listen To
- How I Finally Got My Gaming Backlog Under Control
- How I Track Everything I Watch, Read and Play in Google Sheets
- Google Sheets vs Notion for Tracking Hobbies
- How to Build a Year-in-Review Dashboard for Your Hobbies
- The Board Gamer's Guide to Tracking Cost Per Play
- Why I Stopped Using Vivino and Started Tracking Wine in a Spreadsheet