Letterboxd Is Great but It Can't Do This
I still have my Letterboxd account. I log in maybe once a week to rate a movie or browse lists. The community is great, the interface is beautiful and the recommendation lists are genuinely useful for picking what to watch next.
But Letterboxd has blind spots. Big ones. And after a year of bumping into them, I started keeping a spreadsheet on the side. Then the spreadsheet became the main thing. (Full disclosure: I liked it so much I turned it into a product called WatchFlux.)
The TV show problem
Letterboxd is movies only. No TV shows, no miniseries, no anime seasons. If you watch 3 movies and 5 TV shows in a month, Letterboxd thinks you only watched 3 things.
I watch more TV than movies. Most people do. Last year I finished 28 movies and 19 TV seasons. On Letterboxd, the 19 seasons don't exist. That's more than half my watching activity just gone.
And it's not just about logging titles. TV shows have episode counts. I wanted to know how many episodes I watched in March, how far I got through a season before dropping it, whether I actually finished that show everyone kept recommending. Letterboxd can't answer any of those questions because it doesn't know TV exists.
No platform tracking, no spending data
I pay for 4 streaming subscriptions. Netflix, Max, Hulu and Disney+. That's about $55/month. But I had no idea how many of those I was actually using.
Letterboxd doesn't have a "where did you watch this" field. There's no way to tag a movie with "Netflix" or "theater" or "friend's Plex server." So I couldn't answer the most basic question: am I getting my money's worth from these subscriptions?
Same with spending. If I see a movie in theaters, that's $15. If I rent something on Apple TV, that's $6. Letterboxd doesn't track any of that. My entertainment budget was a black box.
What the spreadsheet actually tracks
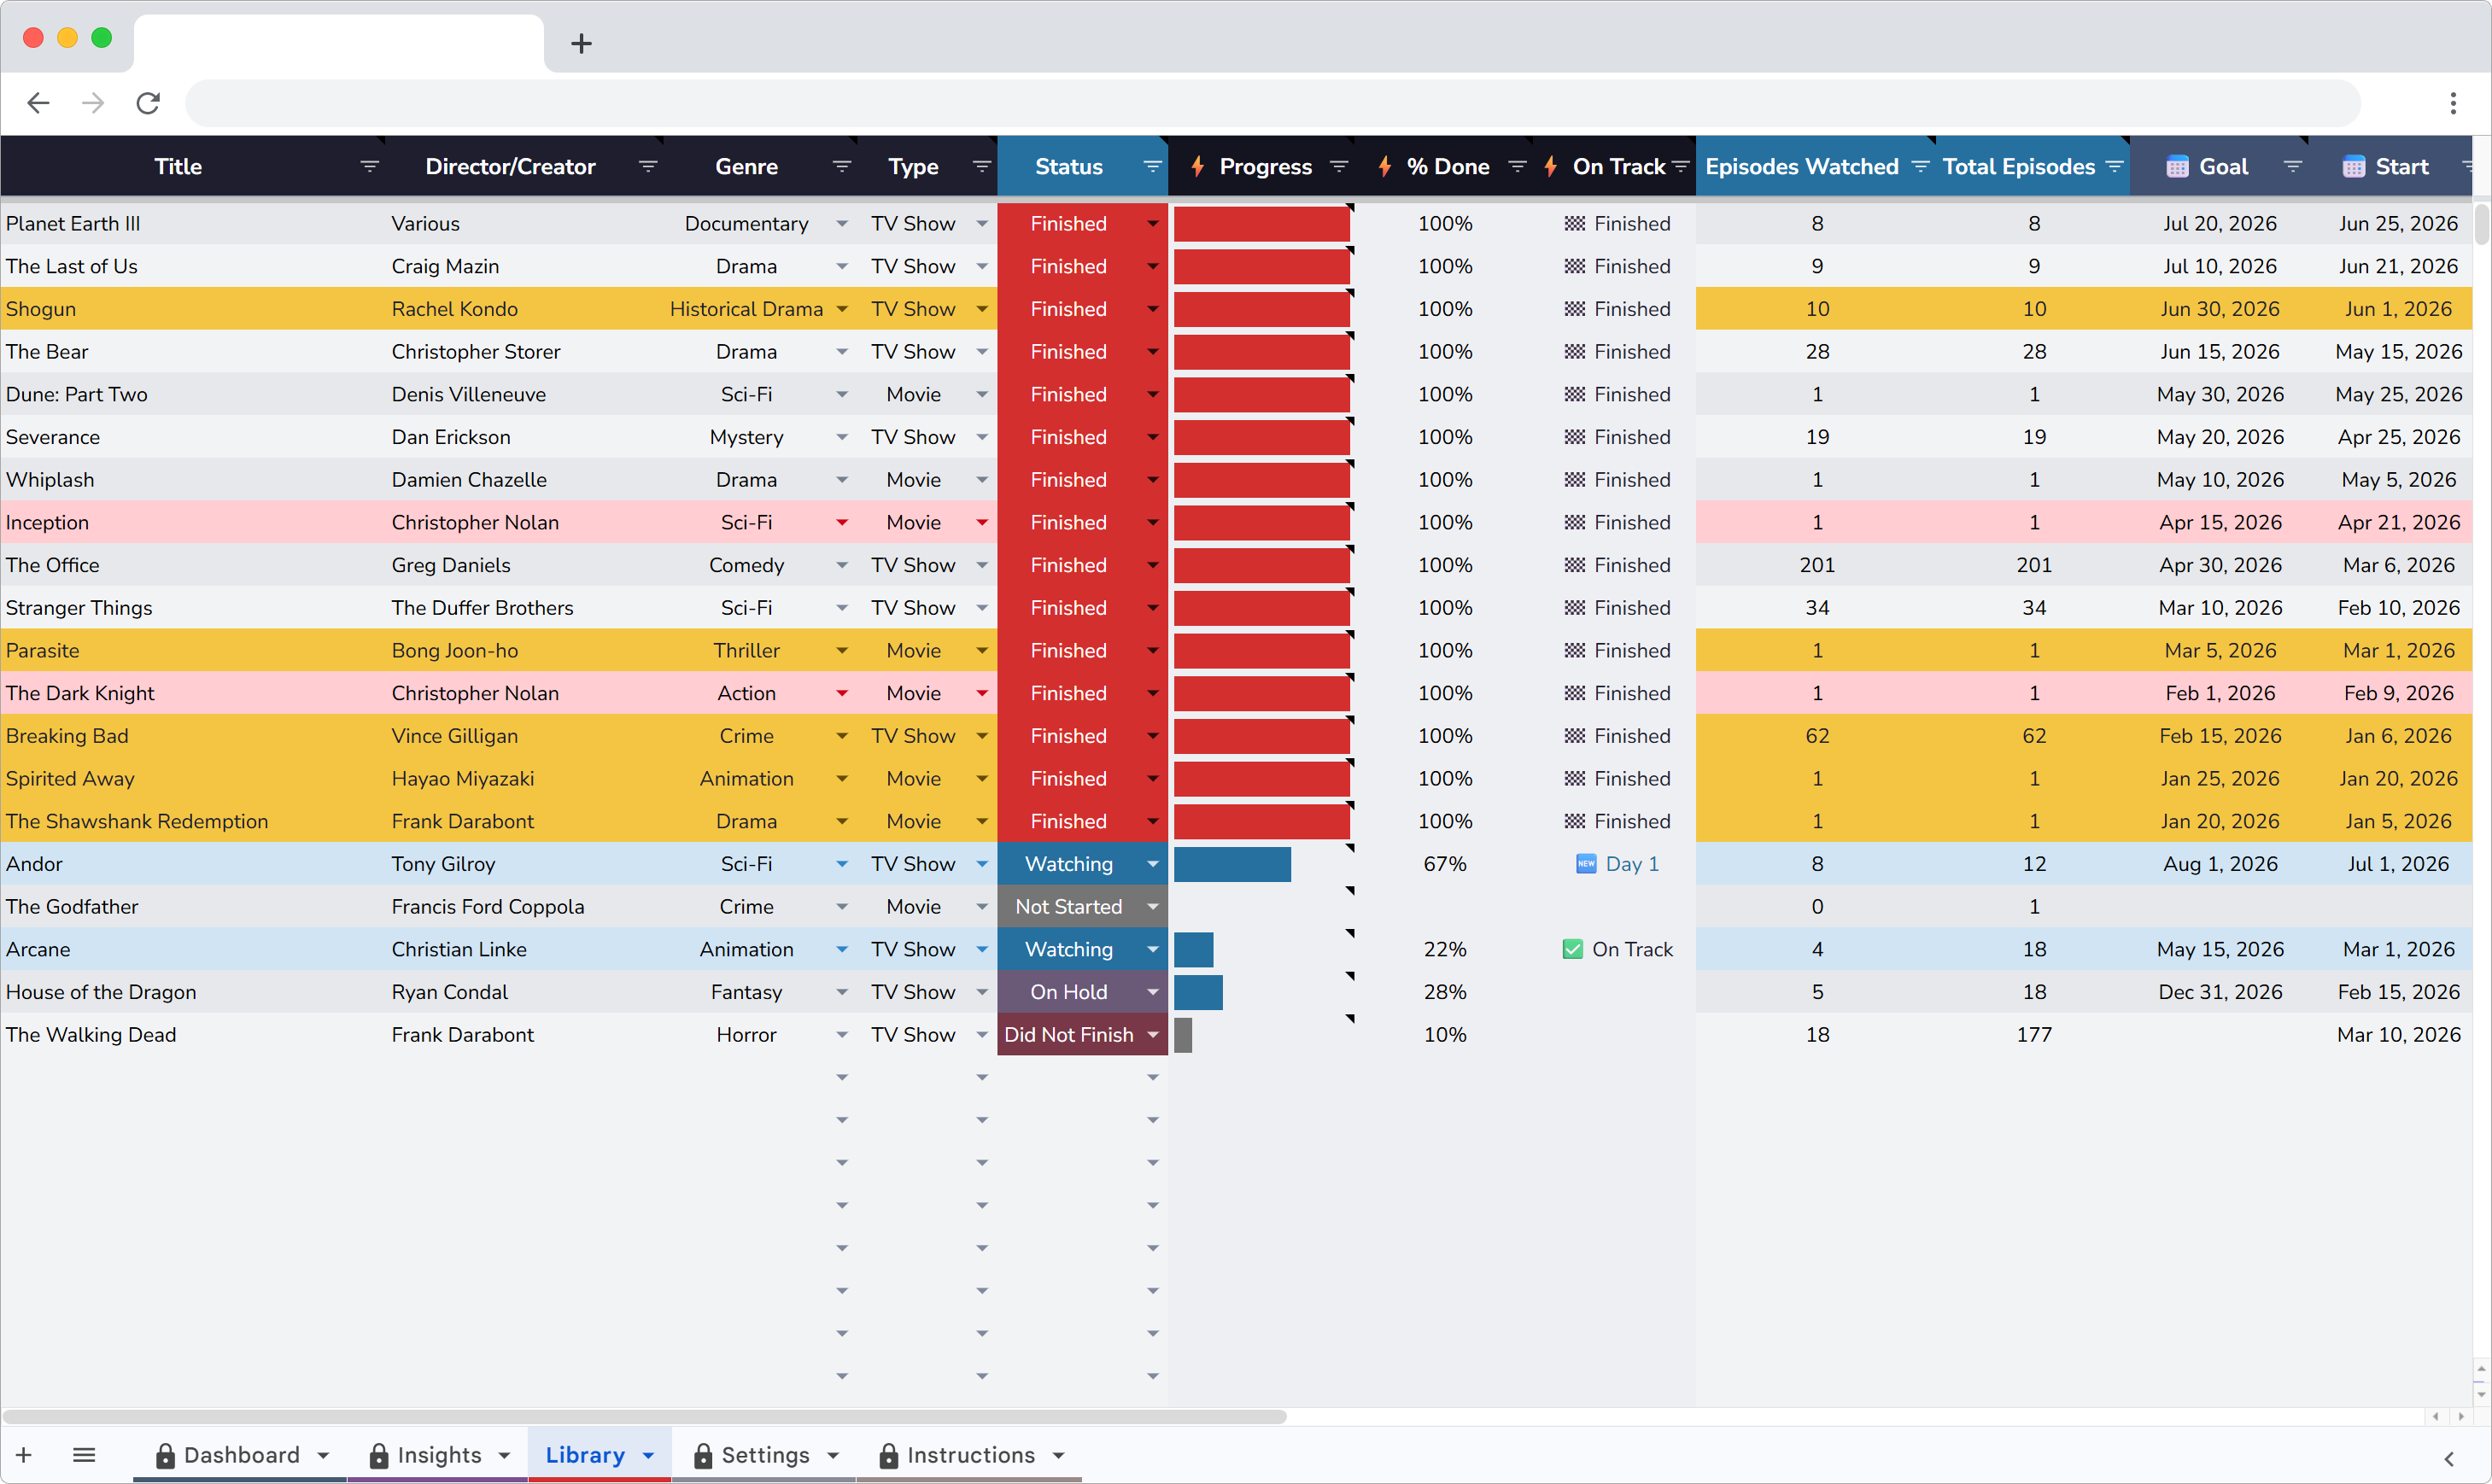
I switched to a Google Sheets setup called WatchFlux. Each row in the Library is a movie or TV show with: title, type, genre, platform, status, rating, date started, date finished, episodes watched and total episodes.
For movies, the episode fields stay blank. For TV shows, they fill in and the math happens automatically. A 10-episode season where I've watched 7 shows 70% progress. When I log episode 10, the status flips to Finished on its own.
That auto-finish feature is small but it matters. I used to forget to update statuses. Now the spreadsheet handles it through a script that runs whenever I edit the episodes column.
The dashboard I wanted from Letterboxd
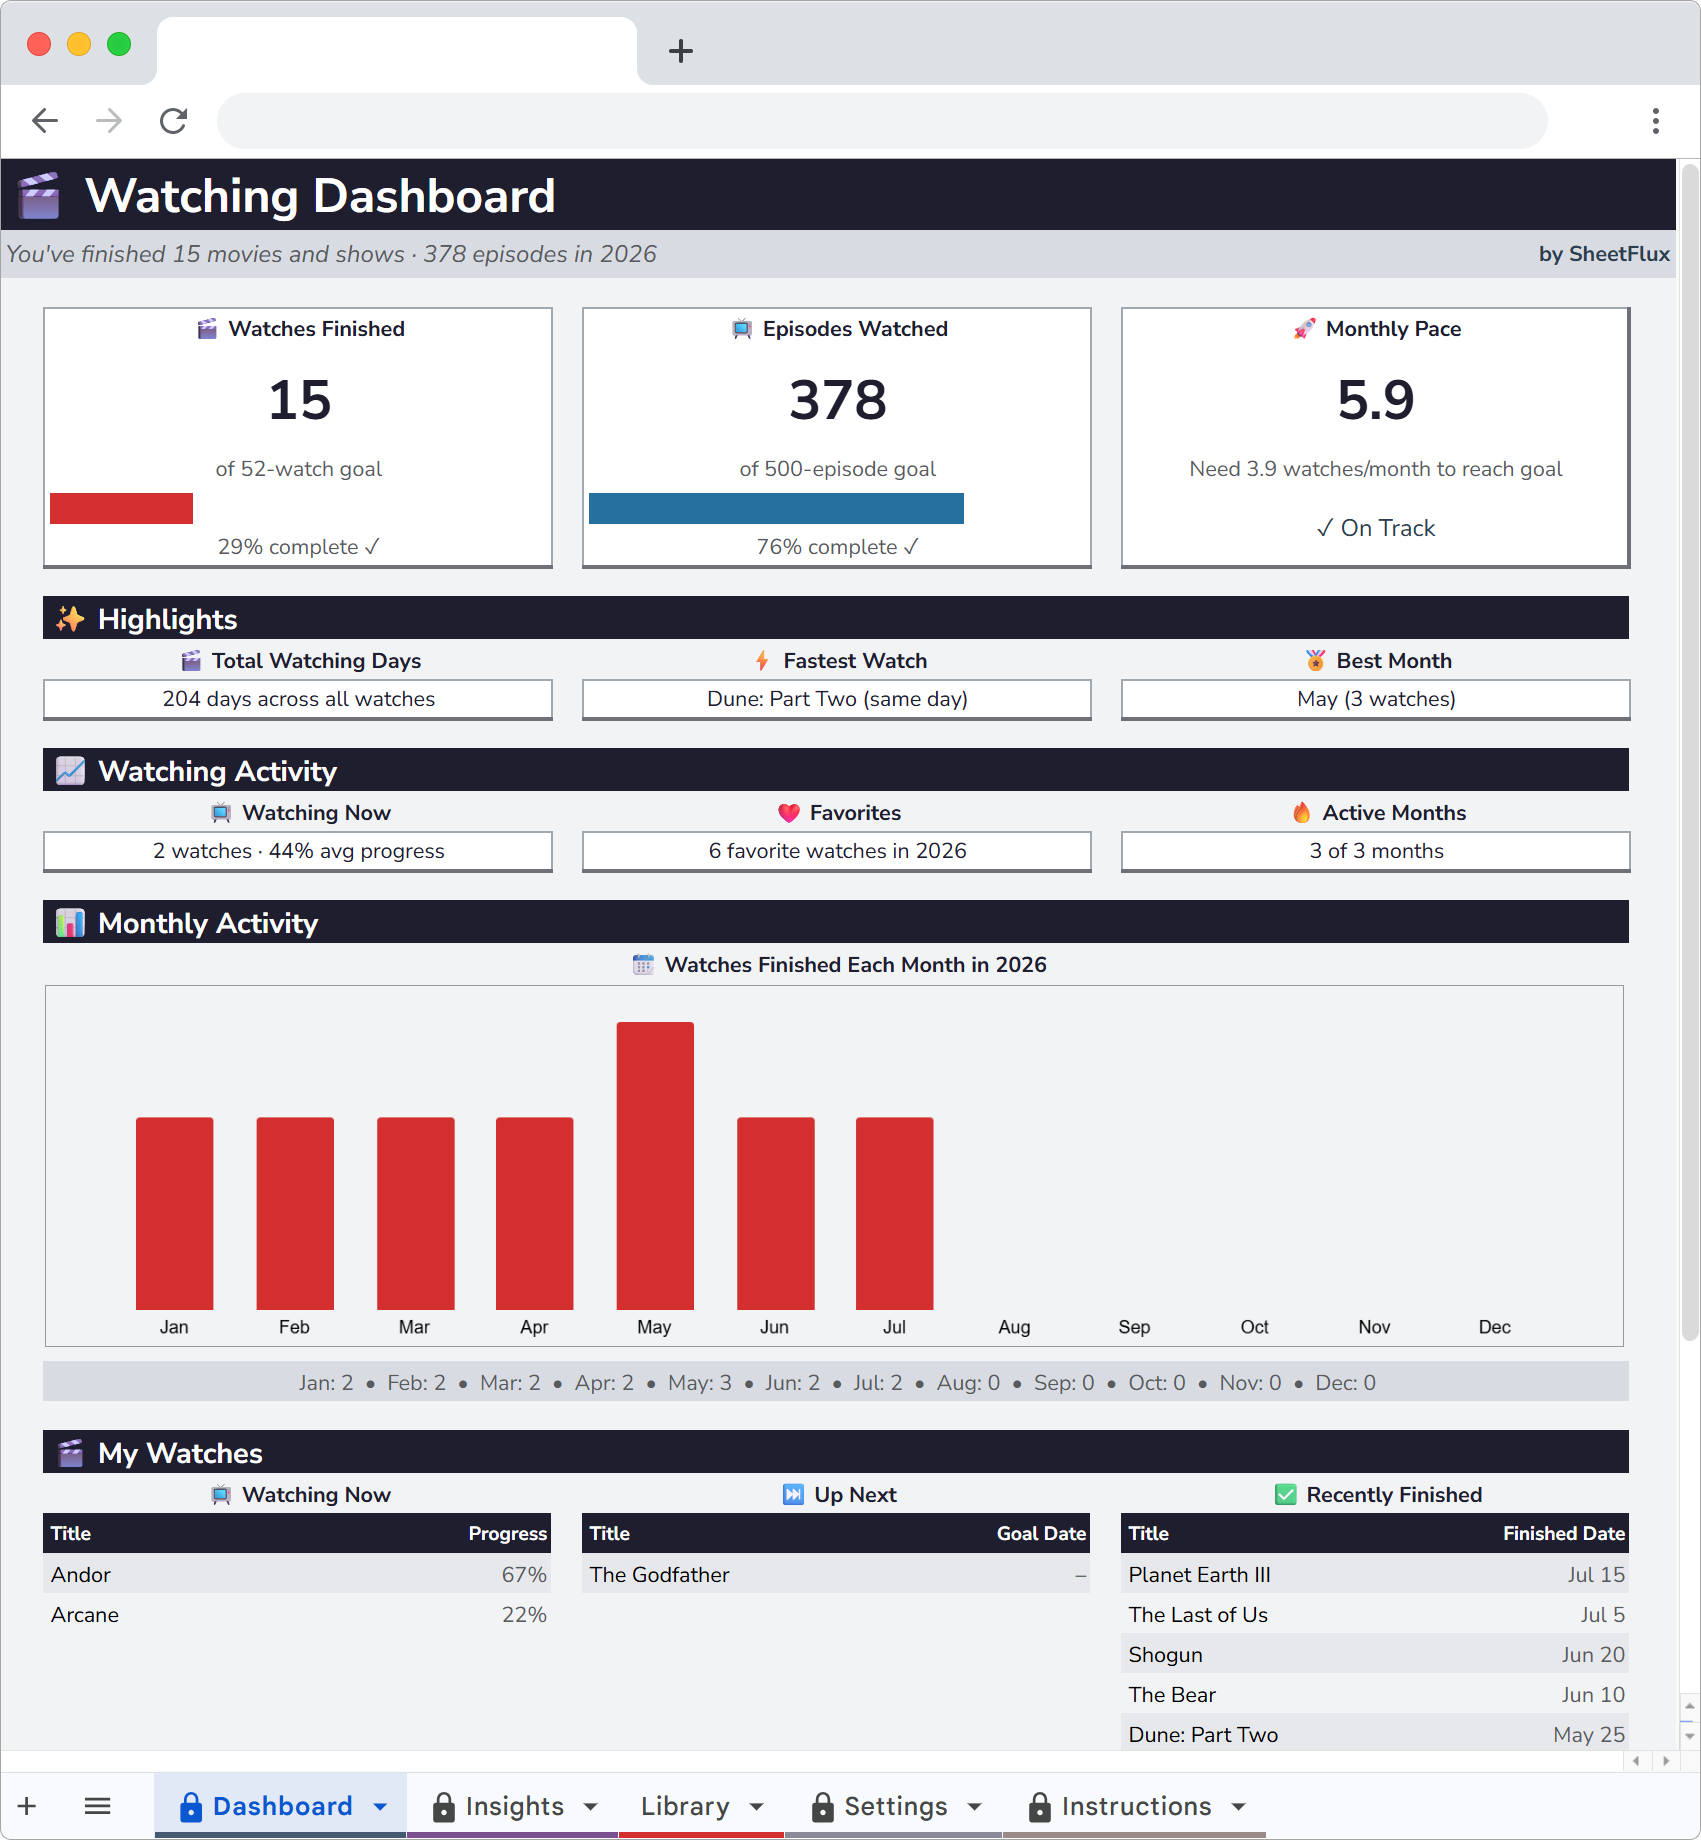
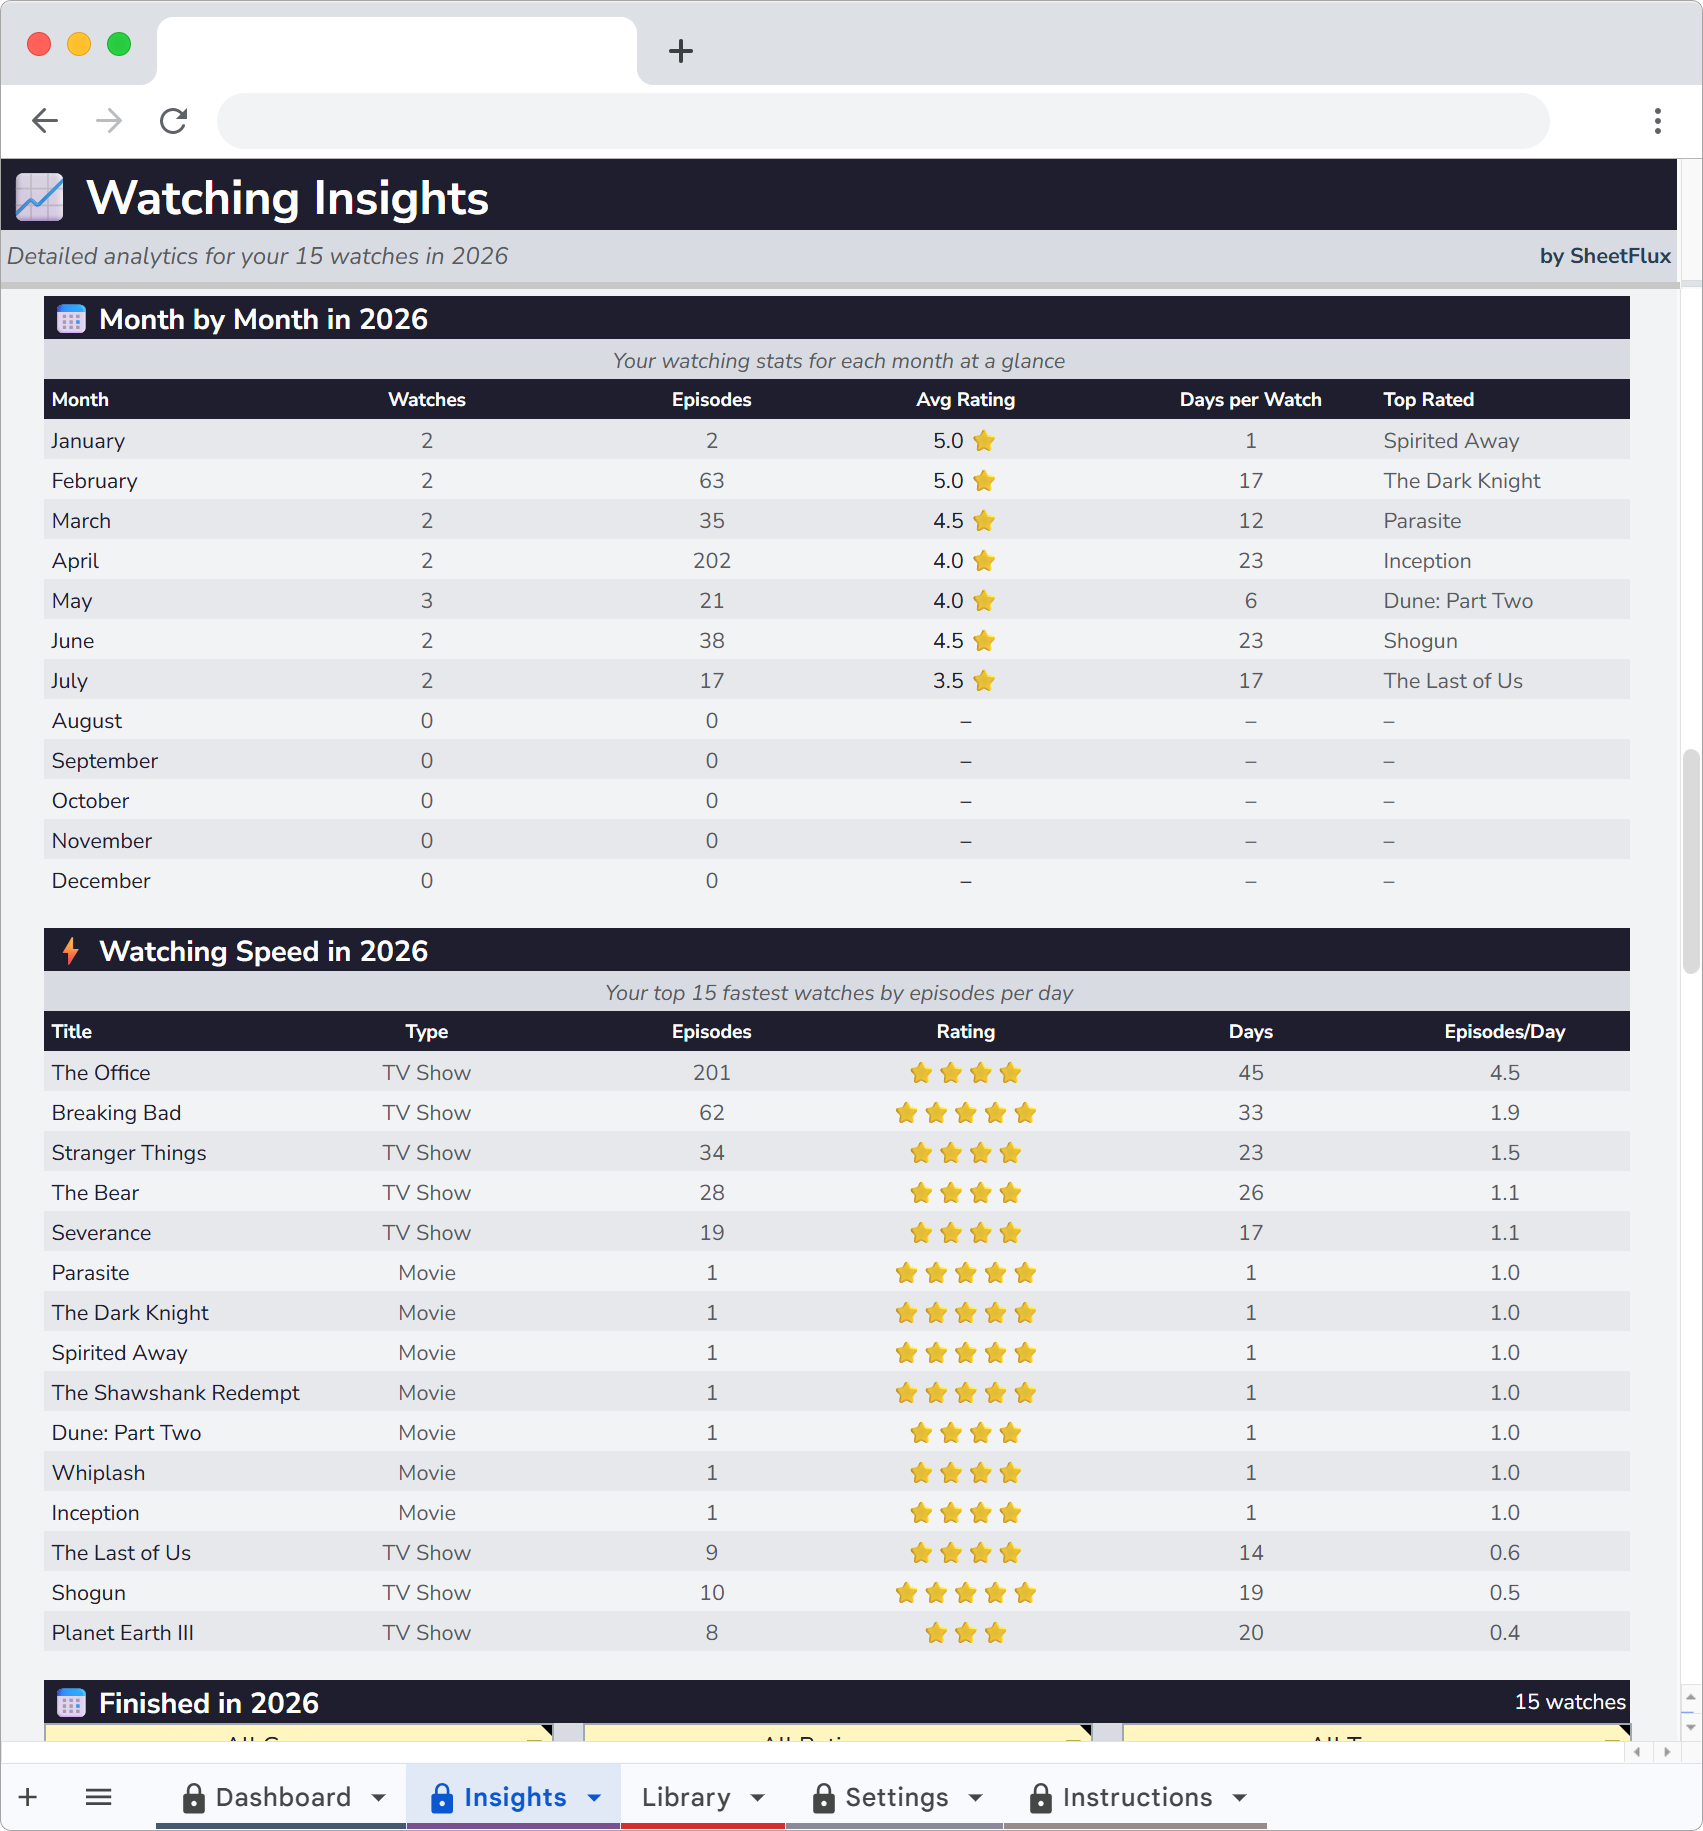
The Dashboard page shows everything at a glance. Movies finished this year, TV seasons completed, total episodes watched, average rating. There's a monthly bar chart that shows activity by month so I can see when I was binging and when I barely watched anything.
January was my slowest month last year. 2 movies, 0 TV finishes. August was the heaviest. I was recovering from a minor surgery and burned through 6 movies and 3 full seasons in four weeks. I would never have remembered that without the data.
Letterboxd has a stats page, but it only counts movies and it doesn't show monthly trends. The yearly total is there. The shape of the year is not.
Genre and type breakdowns
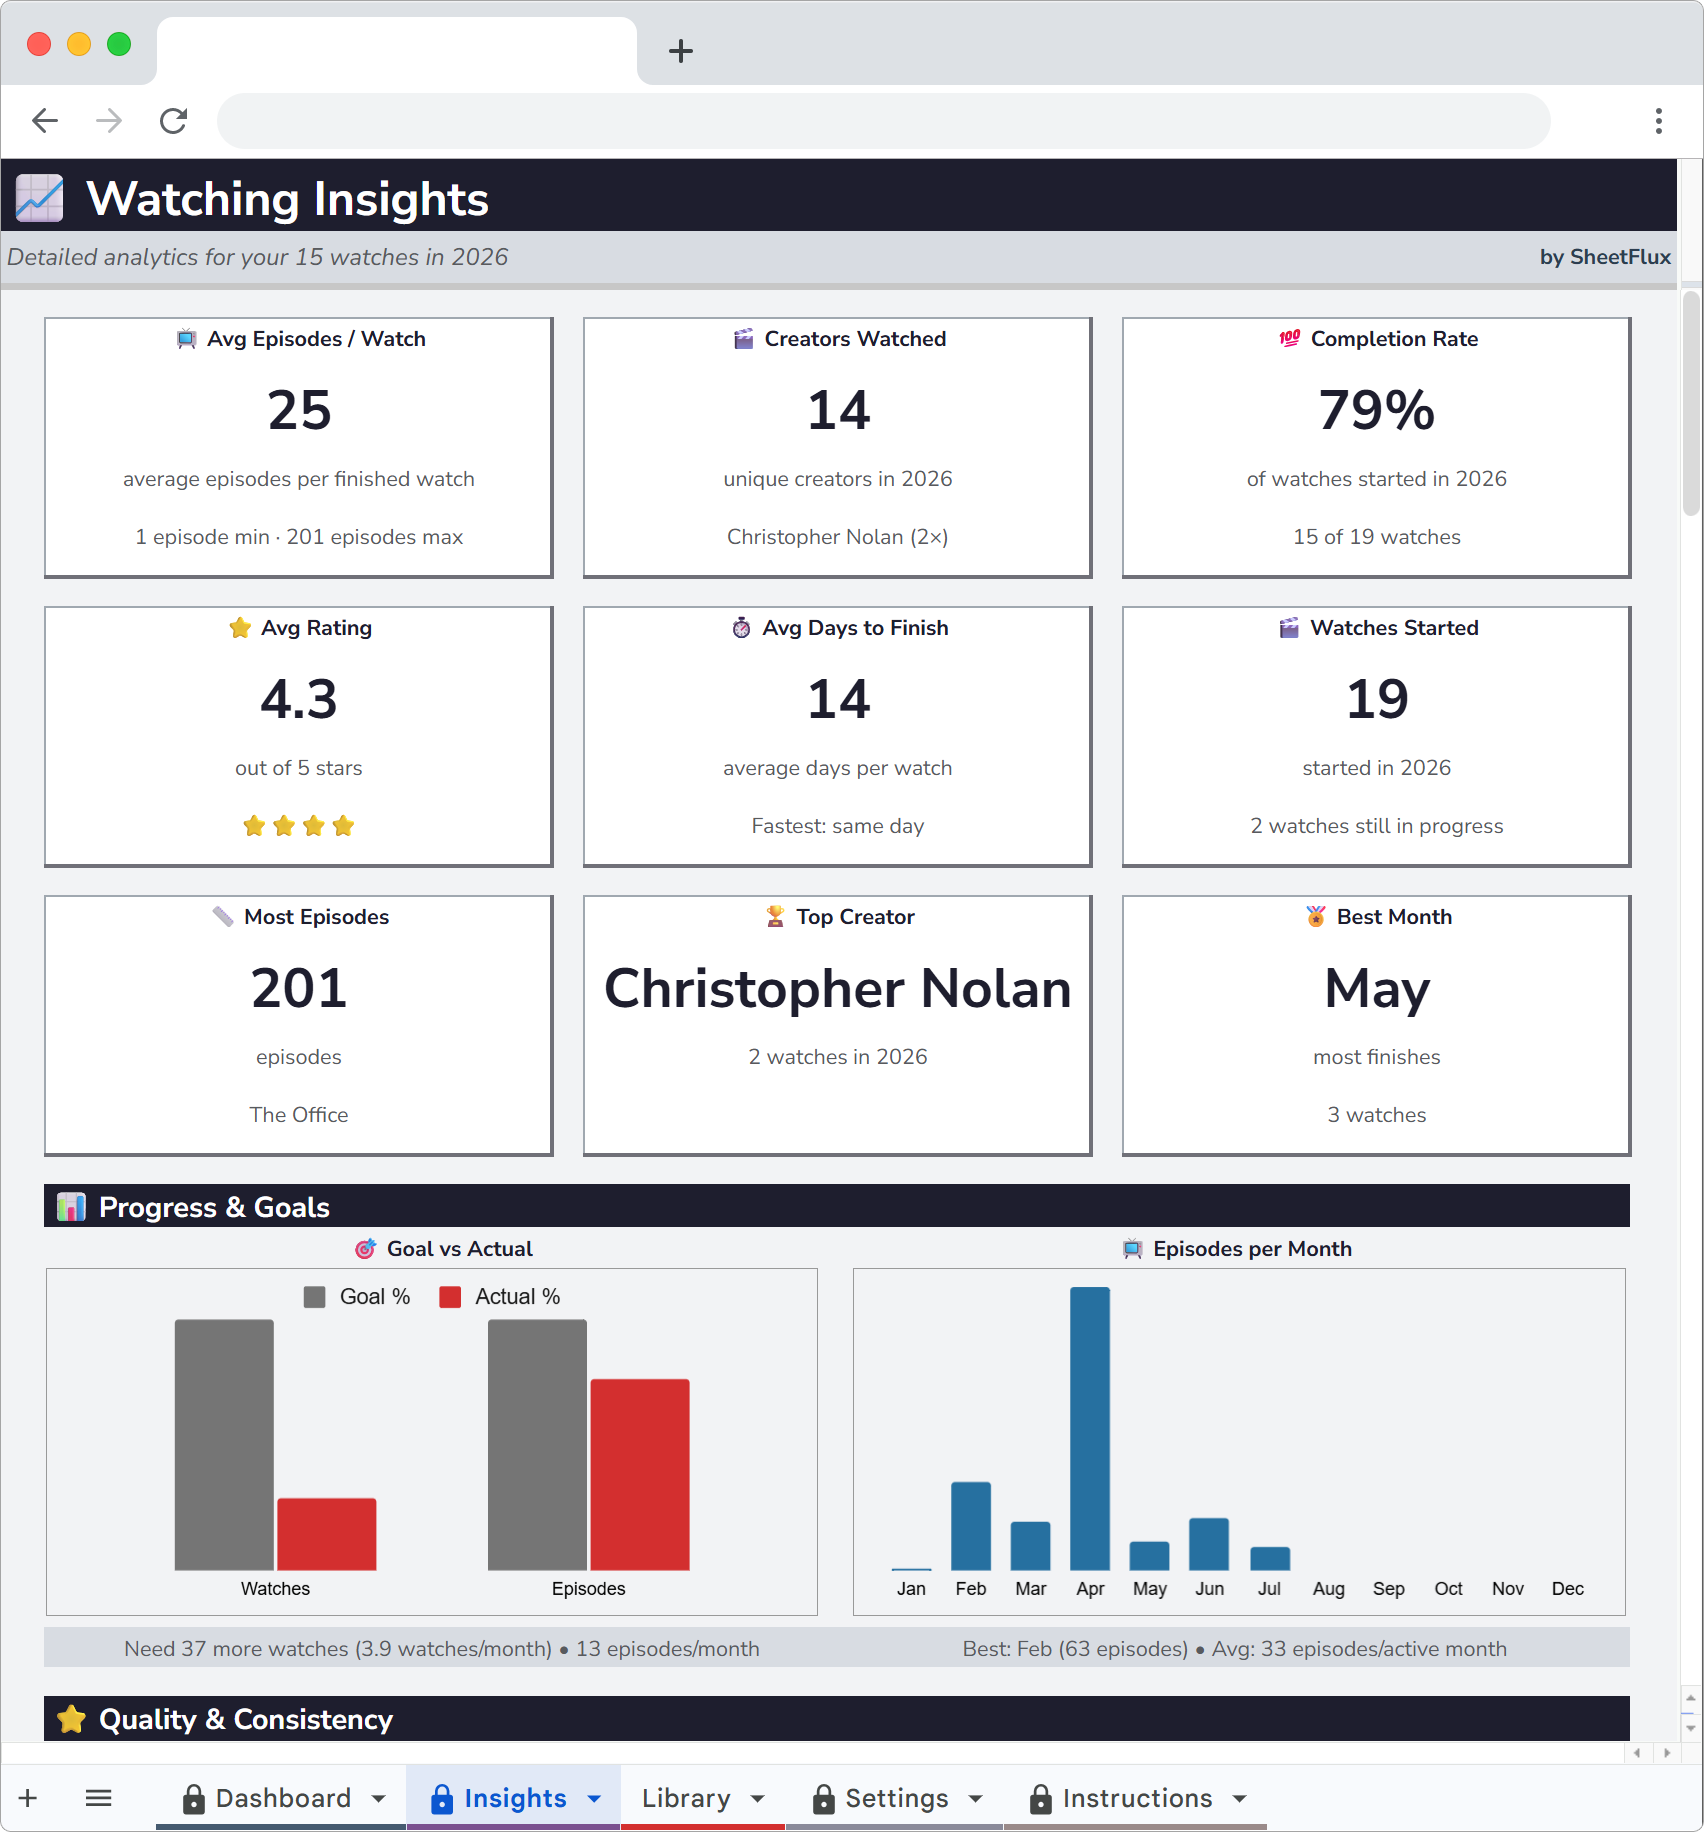
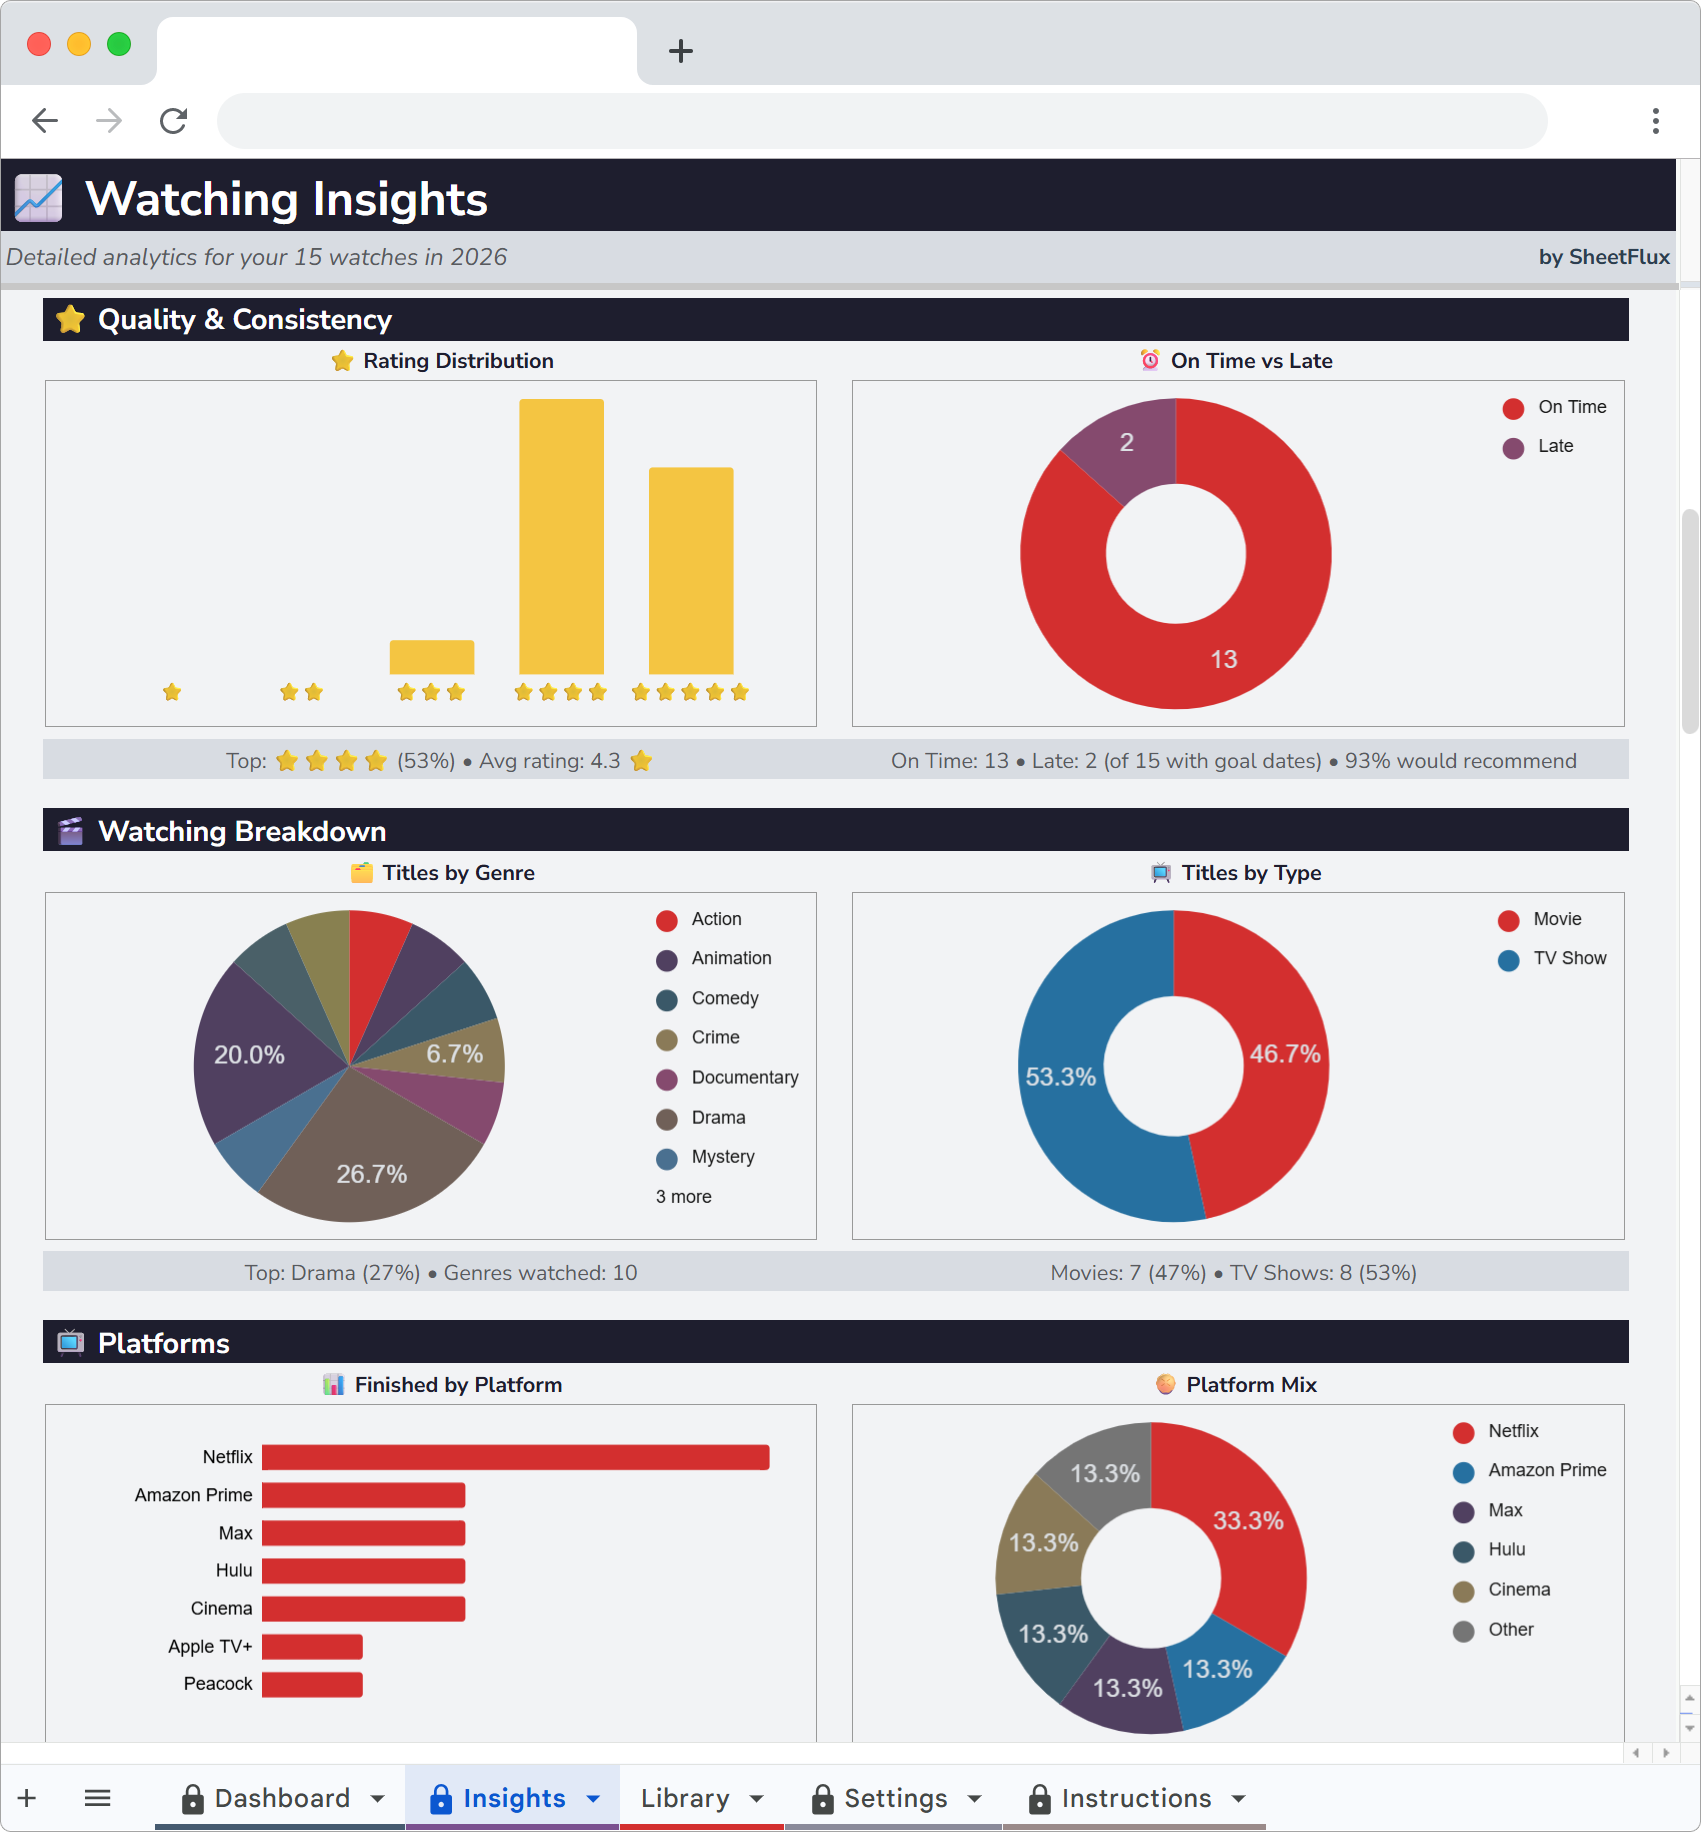
The Insights page has charts that split my watching by genre, by type (movie vs. TV) and by rating distribution. I found out that 65% of my TV watching is drama and sci-fi but only 30% of my movies are. I pick different genres depending on the format and I never noticed until the pie charts made it obvious.
The rating distribution was also revealing. My average movie rating is 3.4 out of 5. My average TV rating is 3.8. I rate shows higher because I self-select harder. If a show isn't grabbing me by episode 3, I drop it. Movies I tend to finish even when they're mediocre.
Monthly trends
There's a monthly trend chart that shows how many movies and episodes I watched each month over the year. This is the chart I check most often. It shows momentum. Two slow months in a row usually means my watchlist has gone stale and I need to add new things.
The chart also helped me notice seasonal patterns. I watch more in winter and less in summer. Not surprising, but seeing the actual shape confirmed it.
The platform math
This is the part that actually saved me money.
After 6 months of tagging every movie and show with its platform, the Insights page showed me something I suspected but couldn't prove: I watched 80% of my content on Netflix and Max. Hulu and Disney+ combined accounted for maybe 12 shows the entire year.
That's $26/month for two services I barely touched. I canceled both. Saved $312 over the year. The spreadsheet paid for itself about 25 times over.
Letterboxd literally cannot do this analysis. There's no platform field, no spending column, no way to connect what you watch to what you pay.
The privacy thing
Letterboxd is a social network. Your diary is public by default. People can follow you, see your ratings, comment on your reviews. Some people love that. I found it made me rate things differently.
I'd give a critically acclaimed film 4 stars instead of the 2.5 I actually felt because I didn't want to explain myself. Nobody on Letterboxd needs to know I thought that Oscar winner was boring. But in my spreadsheet, nobody sees it. I rate honestly because there's no audience.
No followers. No algorithm. No feed of strangers' opinions. Just my data in my Google Drive.
I use both
Letterboxd is still the best place to find movies. The curated lists, the community reviews, the "fans also liked" connections. I browse it for discovery the same way I browse a bookstore. It's good at that job.
But for personal tracking, the spreadsheet does everything Letterboxd can't. TV shows, episode progress, platform analytics, spending data, monthly trends and honest ratings with no social pressure. The two tools solve different problems and I'm keeping both.
Start tracking what you watch
WatchFlux is a Google Sheets tracker for movies and TV shows with episode progress, platform analytics and monthly charts. 20 sample entries included.
More articles
- Why I Ditched Goodreads for a Spreadsheet
- I Replaced My Gaming Backlog App with a Spreadsheet
- Why I Quit Untappd and Track Beer in Google Sheets
- I Left Ravelry and Track My Projects in a Spreadsheet Now
- Why I Started Logging Every Drawing I Make
- How I Finally Started Finishing Craft Projects
- How I Track My Comic Collection Without Losing My Mind
- How I Track Every Movie and Show I Watch
- I Tracked Every Book I Read for a Year
- How I Track My Online Courses in Google Sheets
- How to Track Every Concert You Go To
- Why I Track Every Album I Listen To
- How I Finally Got My Gaming Backlog Under Control
- How I Track Everything I Watch, Read and Play in Google Sheets
- Google Sheets vs Notion for Tracking Hobbies
- How to Build a Year-in-Review Dashboard for Your Hobbies
- The Board Gamer's Guide to Tracking Cost Per Play
- Why I Stopped Using Vivino and Started Tracking Wine in a Spreadsheet