Why I Quit Untappd and Track Beer in Google Sheets
I had 537 check-ins on Untappd when I stopped using it. Not because I stopped drinking beer. Because the app stopped being useful.
The tipping point was the paywall. Features that used to be free got moved behind Untappd Insider. Venue stats, detailed analytics, ad removal. The free tier started feeling like a demo. I was already annoyed by the ads between check-ins, and now they wanted $5 a month for the features I used to get for nothing.
Five dollars a month doesn't sound like much. But paying a subscription to log what I drink felt wrong. I ended up building my own solution — TasteFlux, a one-time-purchase drink tracker in Google Sheets — but here's the full story of what pushed me there.
Badge fatigue is real
Untappd's badge system is fun for the first hundred check-ins. You unlock "Hop Head" for trying 5 IPAs. You get the "Brewery Pioneer" badge for visiting a new spot. There's a little dopamine hit each time.
After 500 check-ins, the badges stop meaning anything. You've unlocked most of the common ones. The remaining ones are either hyper-specific ("drink 25 lagers brewed in Belgium") or sponsored by breweries you've never heard of. I caught myself checking in beers I didn't even enjoy just to make progress on a badge. That's when I knew the gamification had gone from fun to obligation.
I don't need points for drinking a beer. I just want to remember what I drank and what I thought of it.
What Untappd can't tell you
Here's what I actually wanted to know about my drinking habits, and Untappd had no answer for any of it:
- How much am I spending? Untappd doesn't track price. Not per beer, not per visit, not per month. Zero spending data.
- What about wine and cocktails? Untappd is beer-only. If I had a good Old Fashioned at a bar, there's nowhere to log it. Same for wine at dinner.
- Brewery visit costs. I visit 2 or 3 breweries a month. I wanted to know my average tab per visit. Untappd knows I was there but not what I spent.
- Country and region data. I buy a lot of imports. I wanted to see where my beer actually comes from, broken down by country.
Untappd is a social check-in app. It's built around ratings, badges and a feed. The analytics are thin even on the paid tier.
What I track now
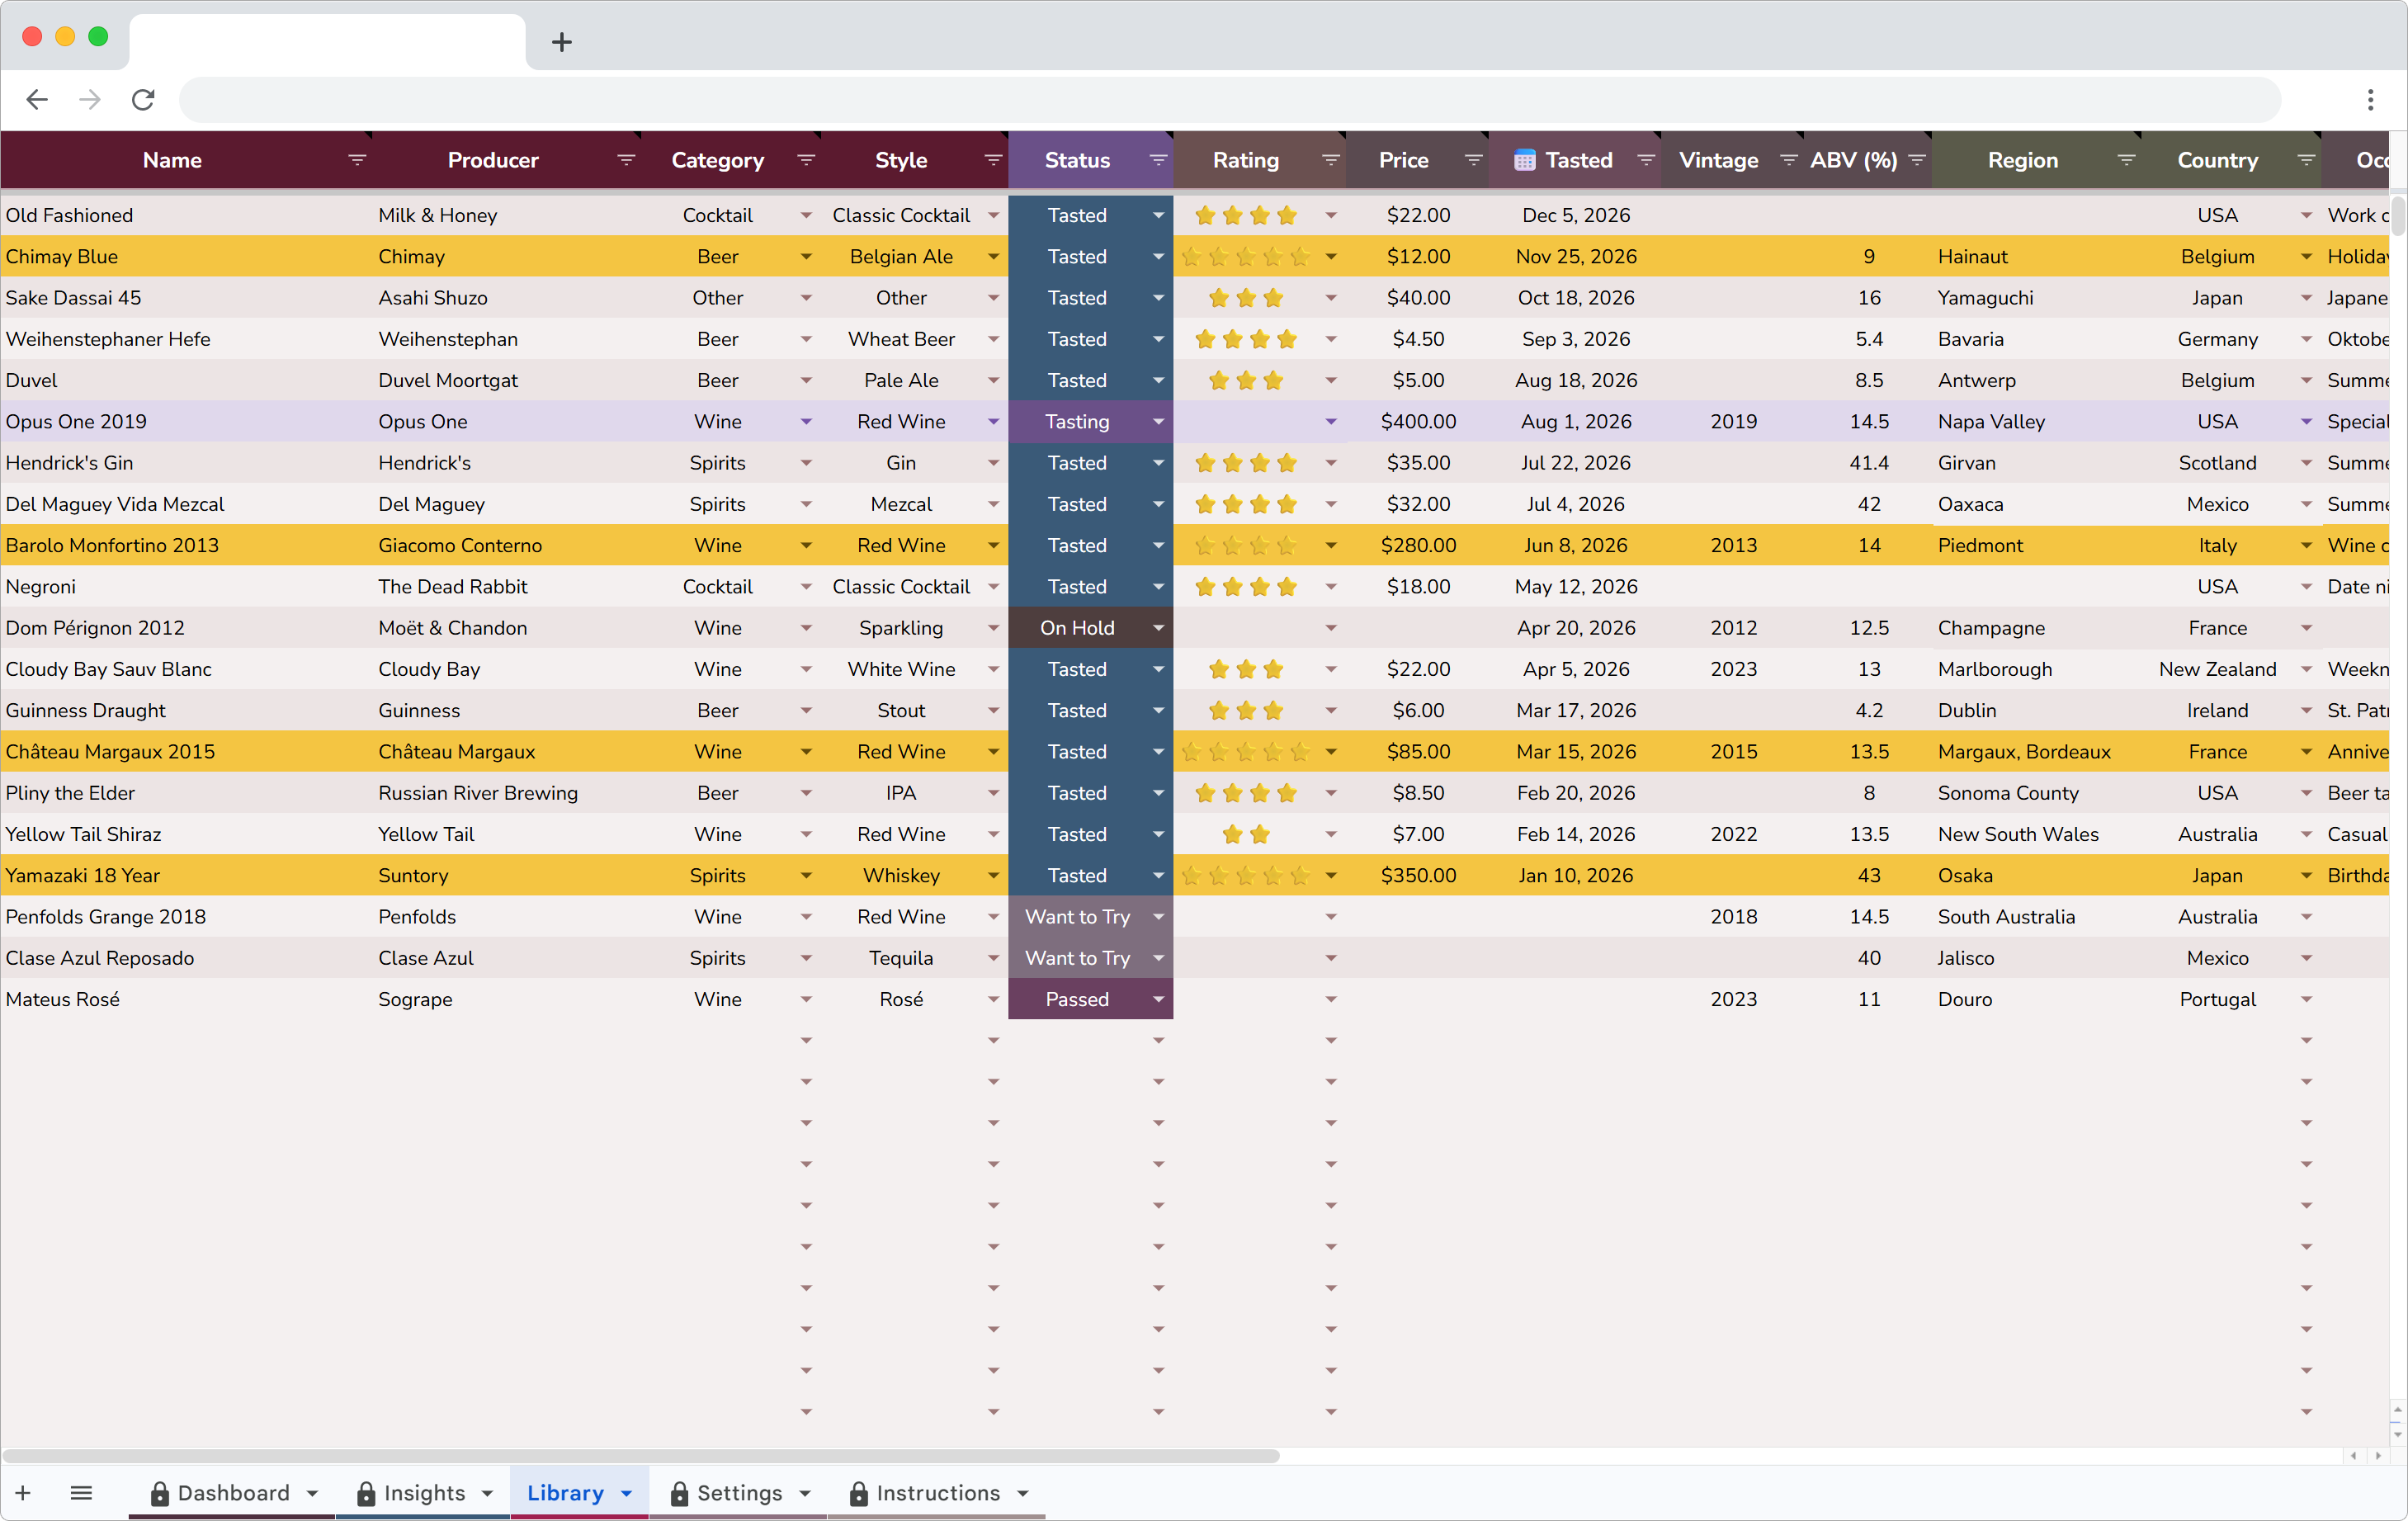
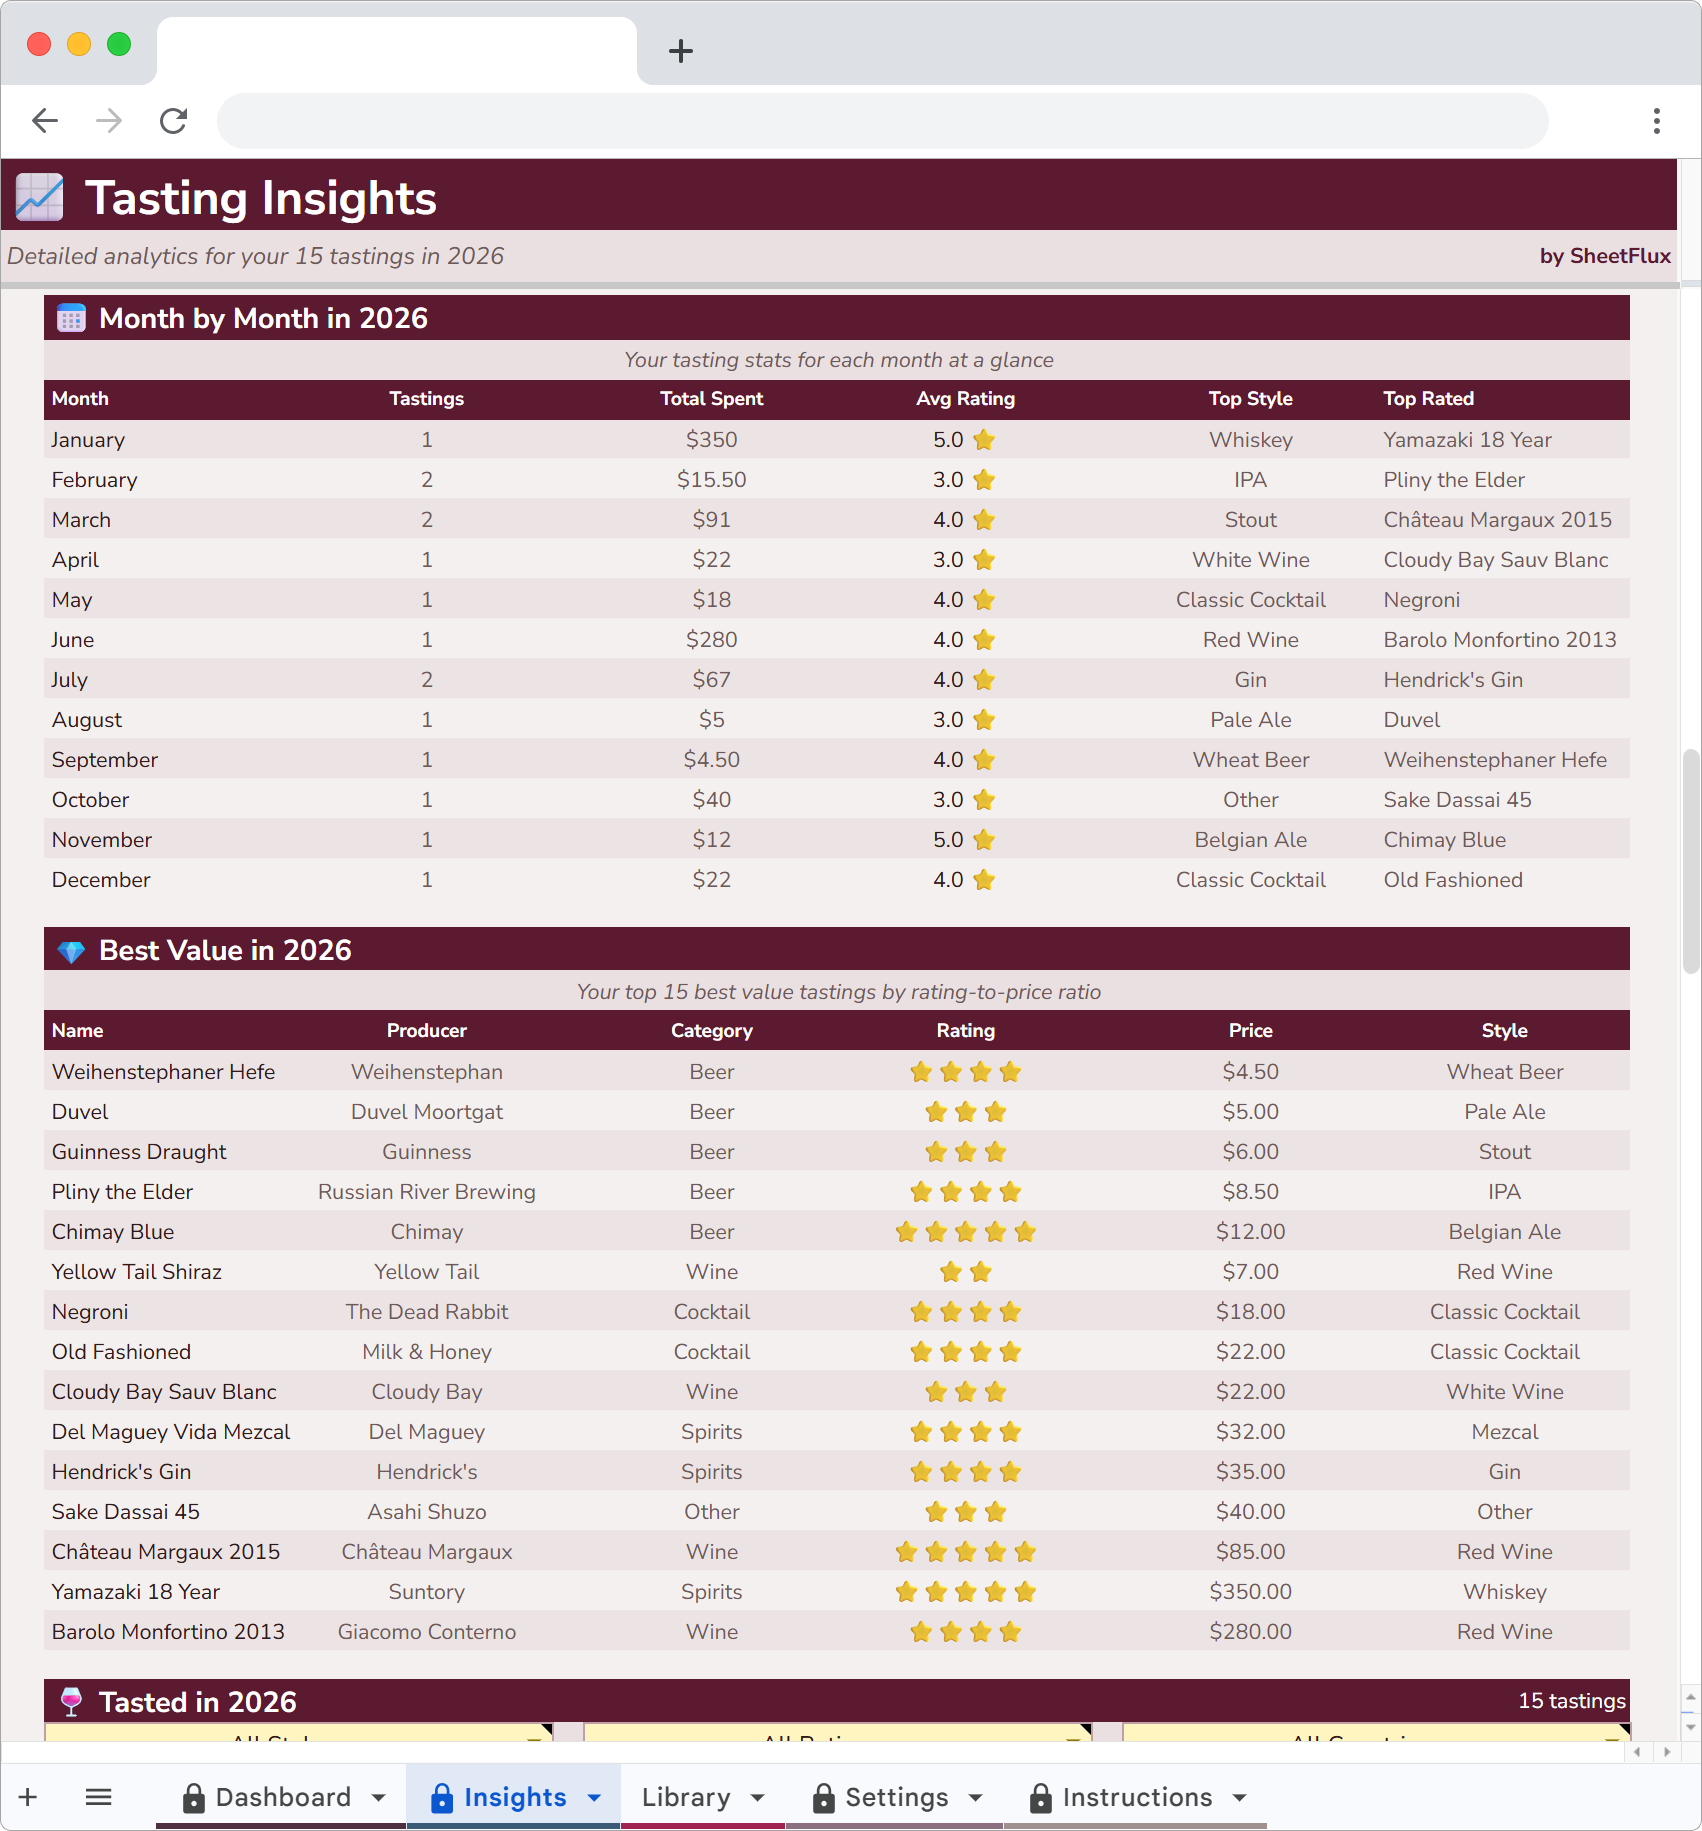
I moved everything to a Google Sheets tracker called TasteFlux. Each row in the Library is one drink: name, type (beer, wine, spirit, cocktail), style, source, country, price, rating and tasting notes.
I log brewery visits, bottle shop pickups, cans from the grocery store, cocktails at a bar. Everything goes in the same sheet. No more splitting my drinking data across multiple apps.
The spending numbers were eye-opening
I averaged $8 per craft beer. I was buying about 3 per week, plus a brewery visit every other weekend. That adds up to over $1,200 a year on beer alone. I had no idea.
The brewery visits were the biggest surprise. My average tab was $42 per visit, which includes a flight, a couple of pints and usually a 4-pack to take home. Twice a month, that's over $1,000 a year just at breweries.
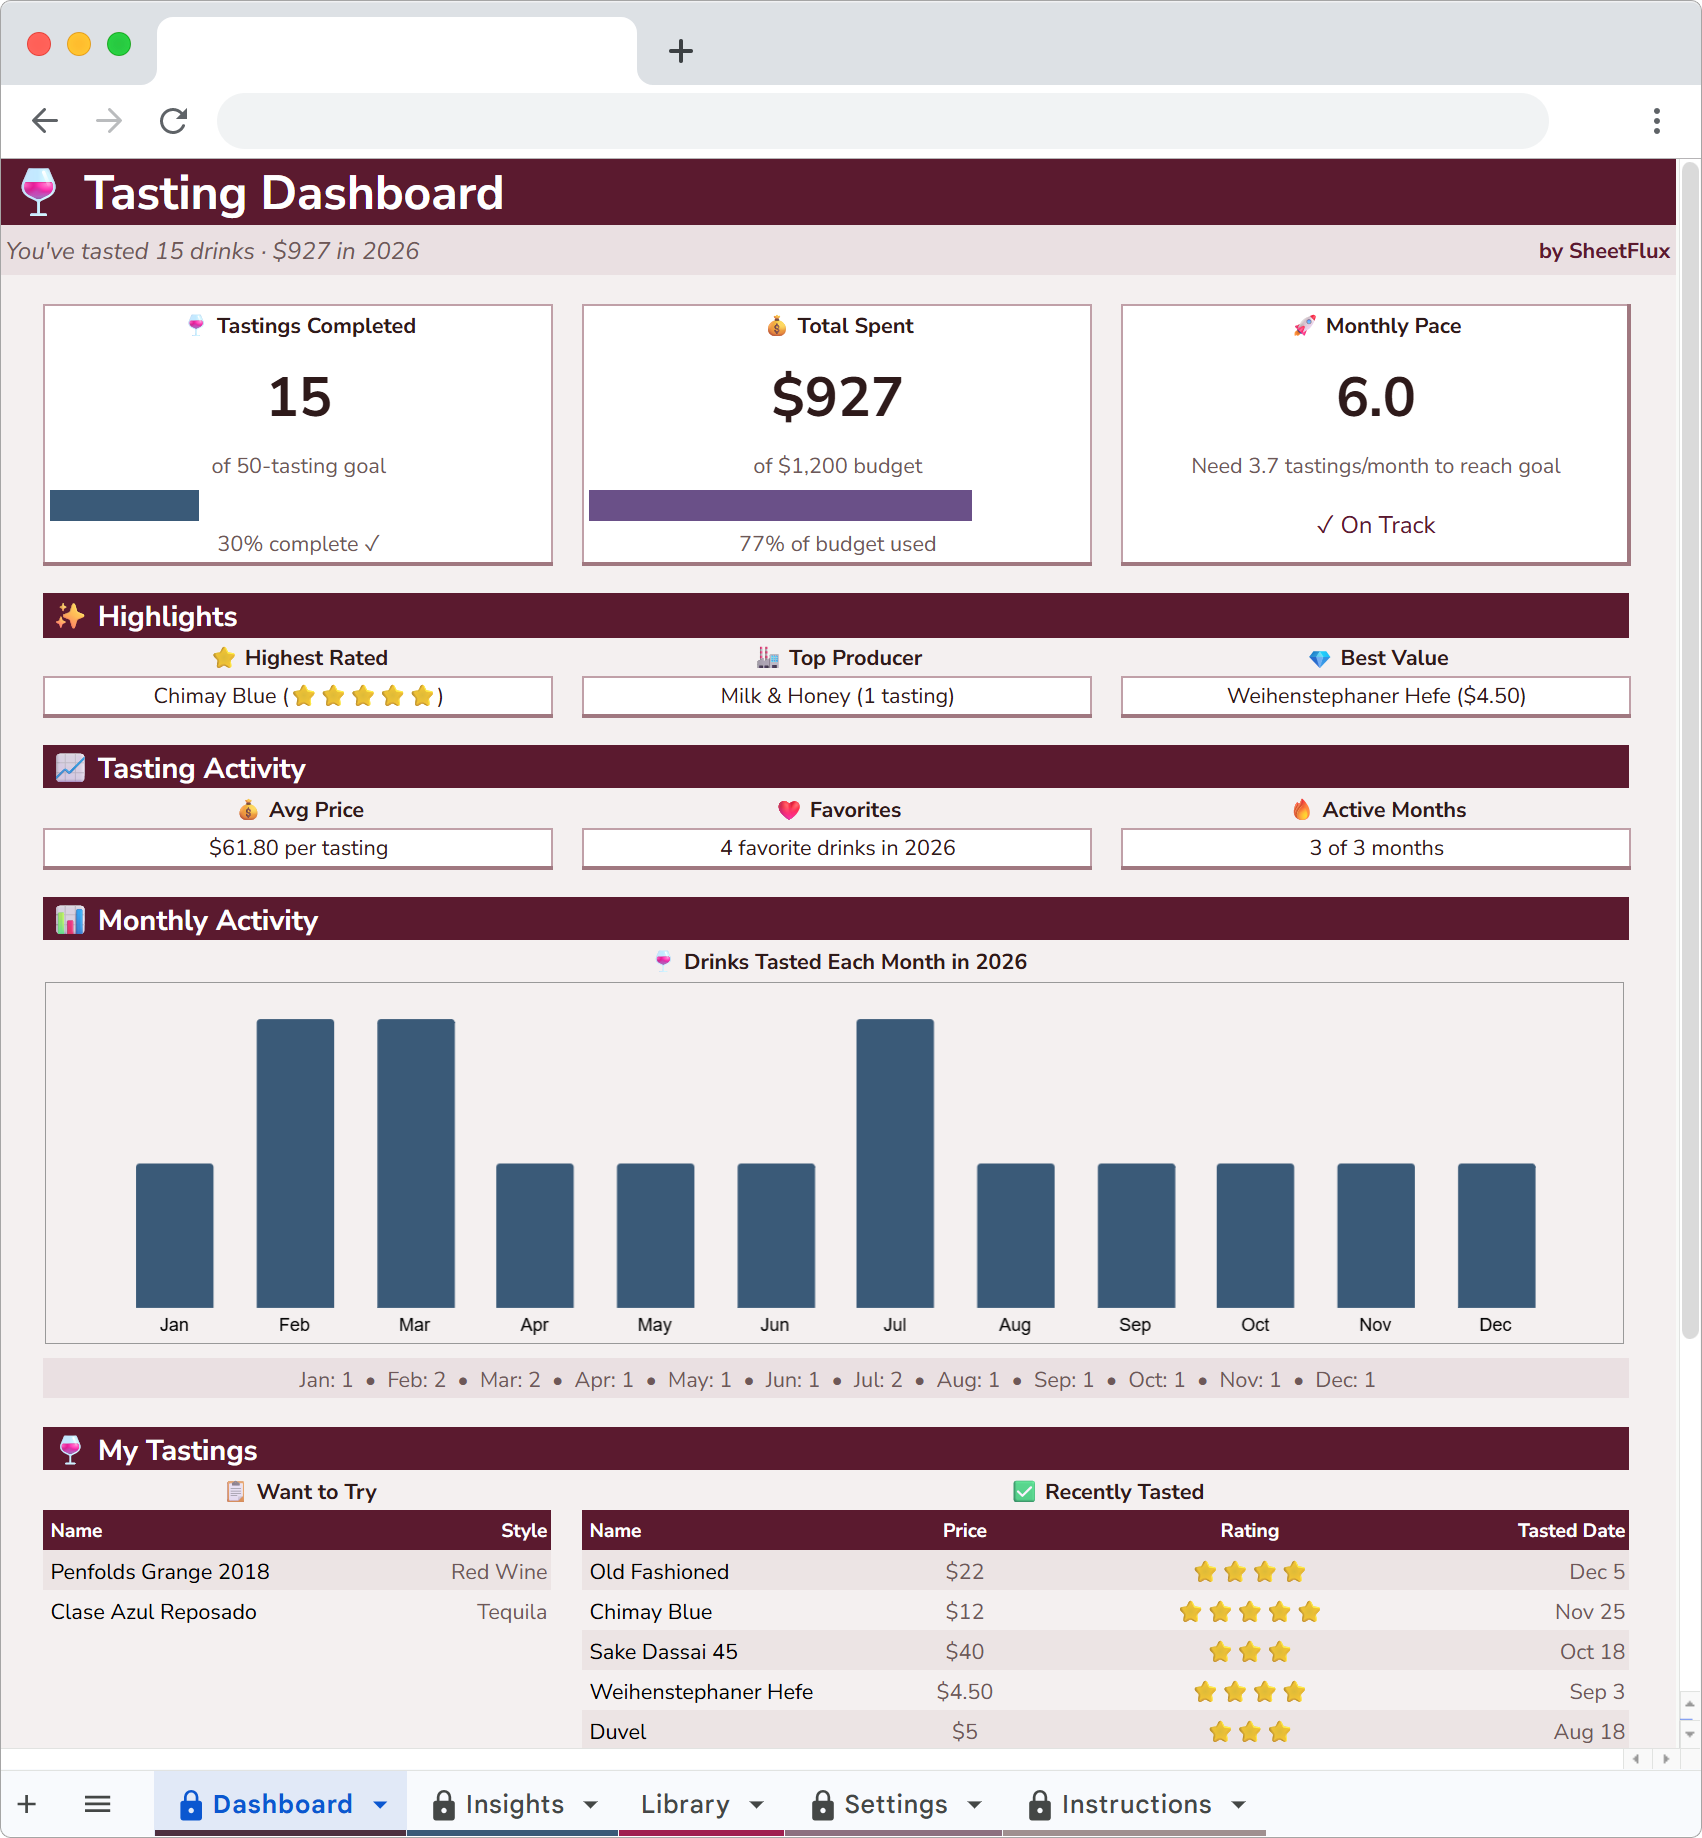
None of this is bad. I enjoy it. But I like knowing the actual numbers instead of a vague "I probably spend too much on beer" feeling. The Dashboard tracks my spending against a yearly budget and shows me which months I go heaviest. December and October are my expensive months. January is always low.
I was stuck in an IPA rut
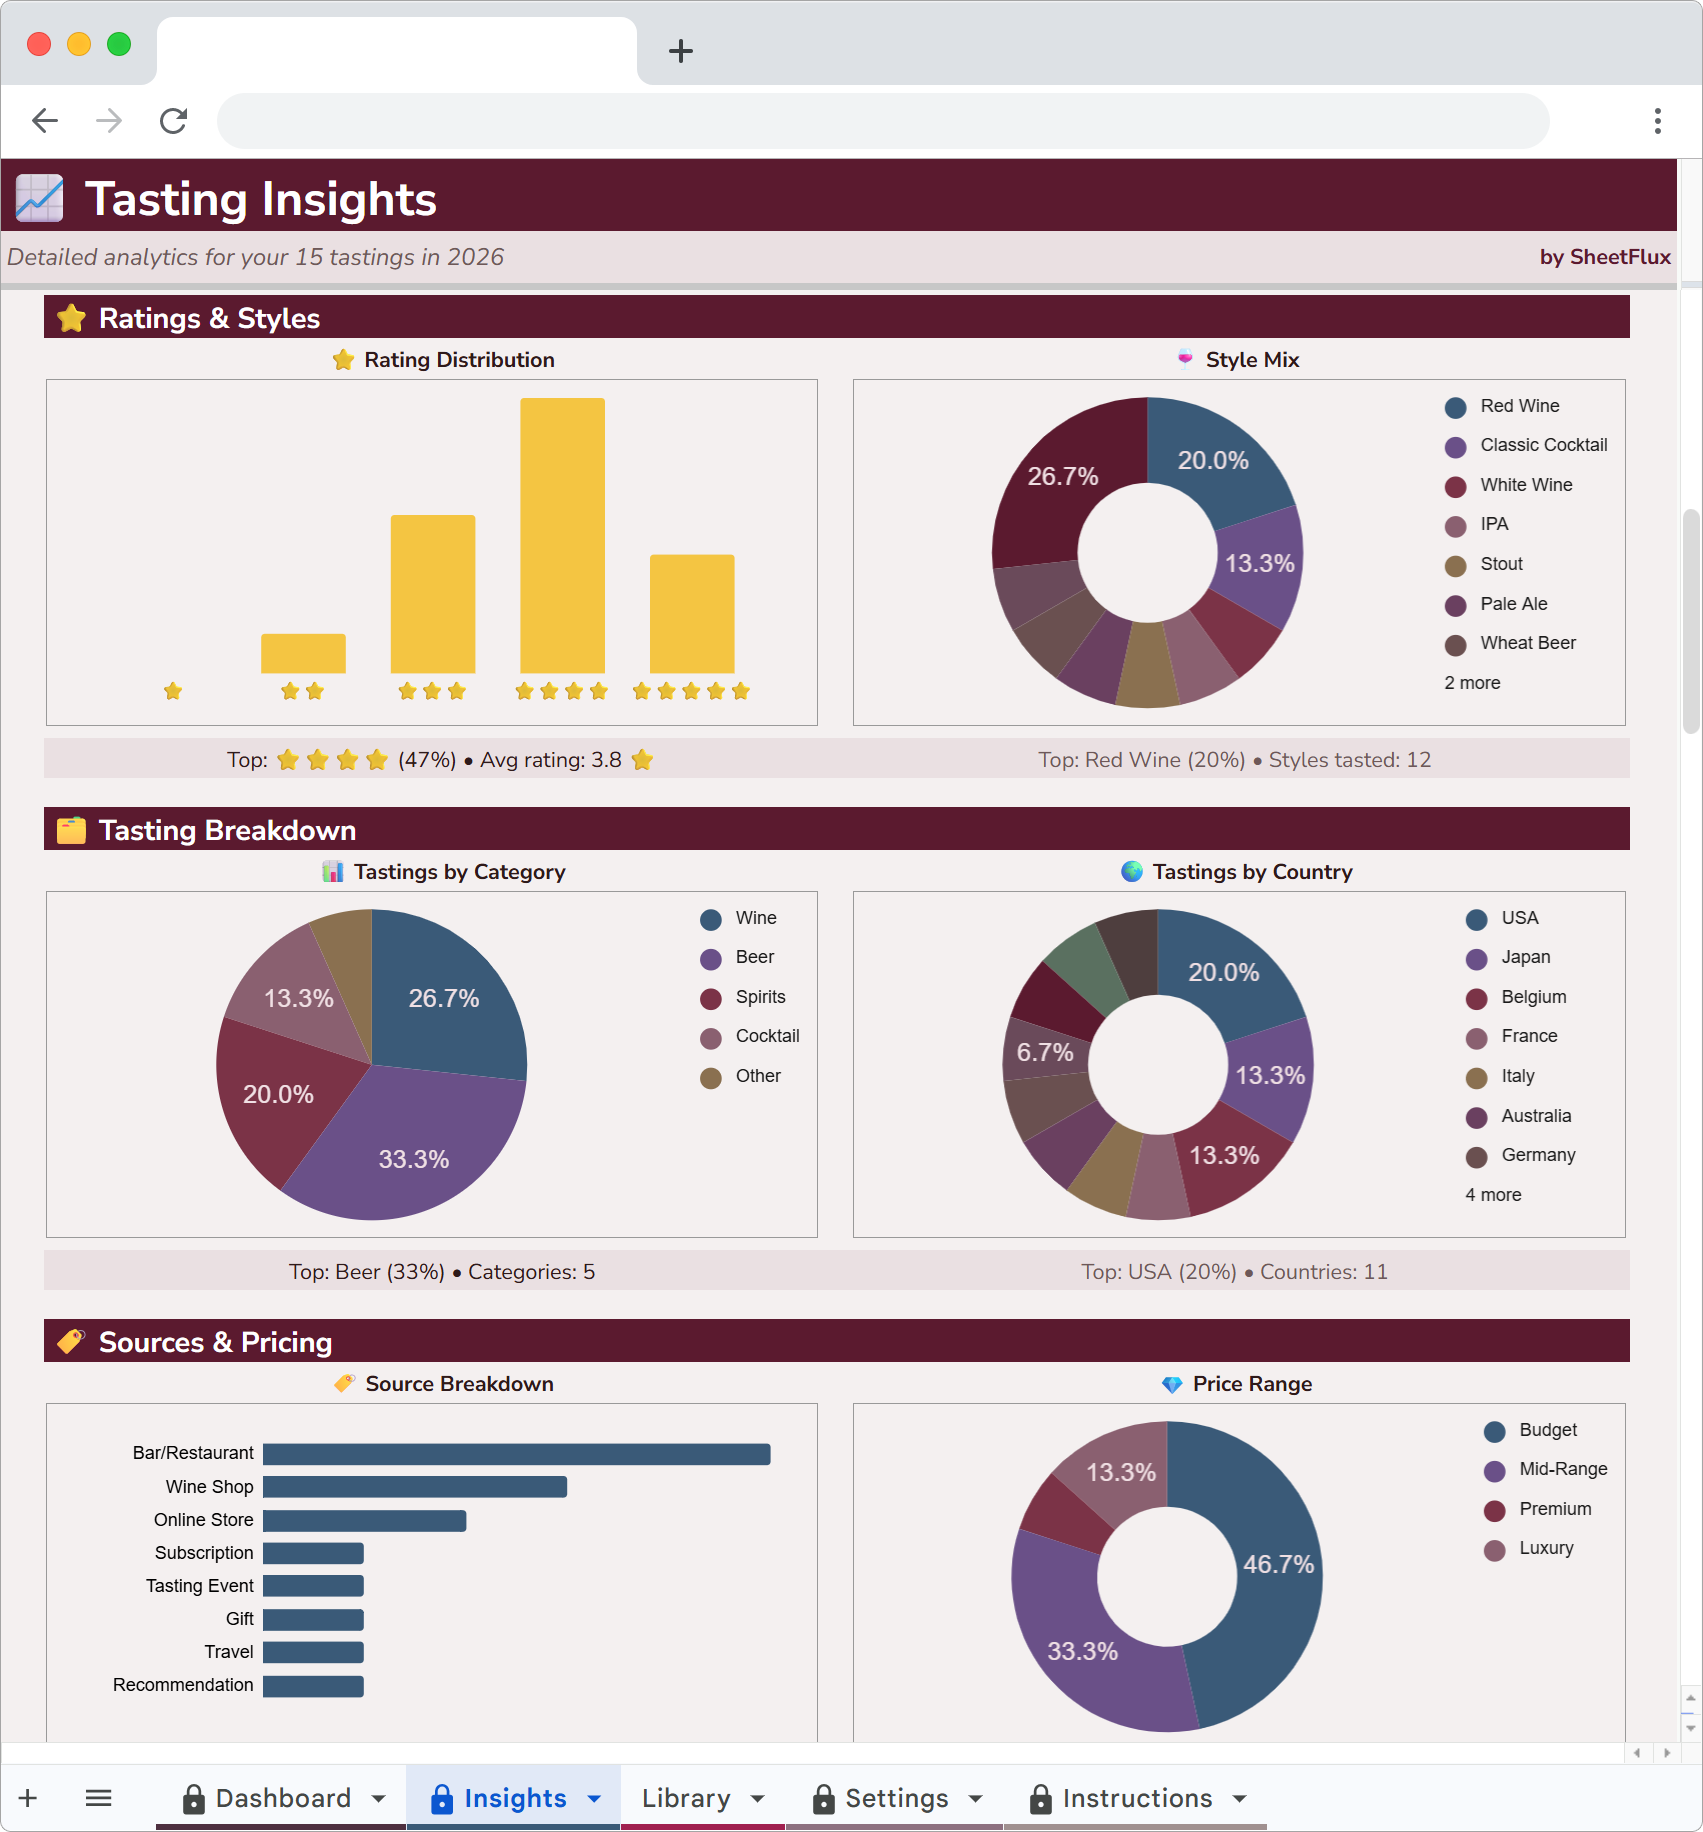
The style breakdown chart showed me something I suspected but never confirmed. About 70% of my check-ins were IPAs. Hazy IPAs, West Coast IPAs, double IPAs, session IPAs. Different labels, same category.
Seeing that number on a chart was the push I needed to branch out. I started deliberately picking up sours, stouts, pilsners and saisons. Three months later, IPAs dropped to about 45% of my total. My average rating for non-IPA styles went up too, which means I was missing beers I actually liked because I kept defaulting to what I knew.
Untappd shows you a style list, but it's buried and there's no chart. You have to count manually. The spreadsheet just shows you the pie chart.
Monthly trends and seasonal patterns
I log about 12 to 15 drinks per month. Some months more, some less. The monthly trend chart showed me I drink the most in summer (patio season, brewery visits) and the least in January and February.
That's not surprising on its own. What surprised me was how consistent the pattern is year over year. July is always my peak month. February is always the bottom. Having two years of data made the seasonality obvious.
Where my beer comes from
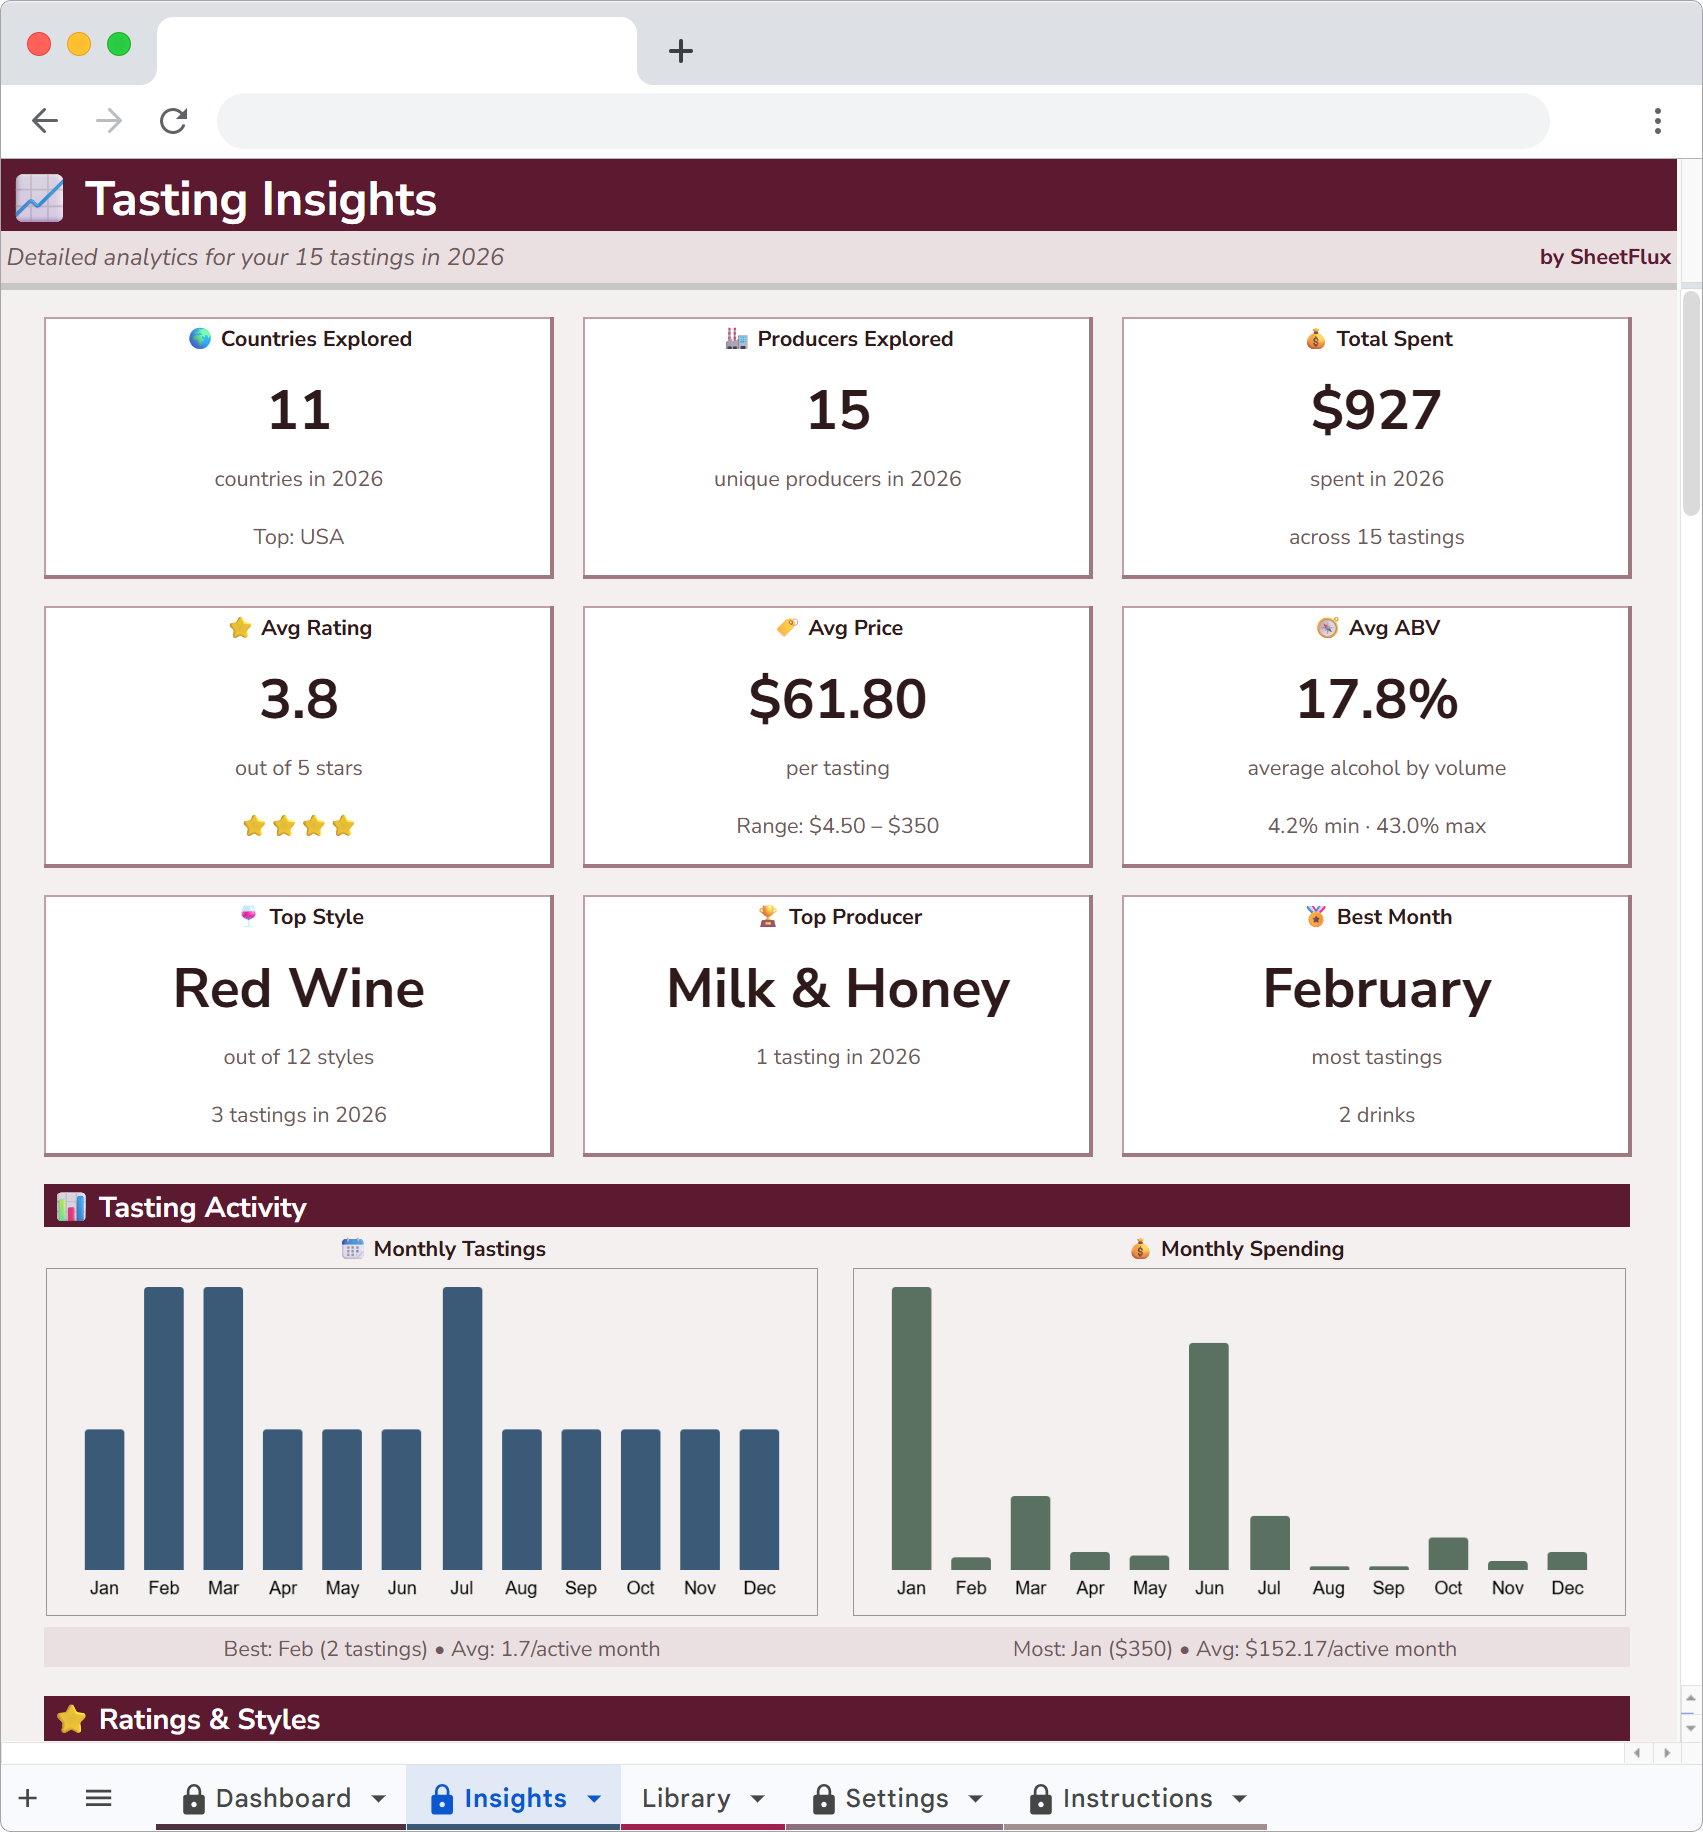
I started filling in the country field for every entry. Most of my beer is domestic, but I buy a fair amount of Belgian, German and Mexican imports. The country breakdown chart showed me I was buying more Belgian beer than I realized, mostly tripels and quads from the same three breweries.
The source field is useful too. I can see how much comes from breweries vs. bottle shops vs. grocery stores vs. bars. Turns out I buy about 40% of my beer at bottle shops, 30% at breweries and the rest split between bars and grocery runs.
No more broadcasting every drink
Untappd is a social network. Every check-in goes on a feed. Your friends see what you're drinking, where you are, how often you drink. I never loved that. I started unchecking the social sharing options, which defeated half the point of the app.
A spreadsheet in my Google Drive is private by default. Nobody sees it. No feed, no followers, no sponsored content. My tasting notes are for me. Some of them are just "meh" or "would not buy again." That's fine. They're not performing for an audience.
Untappd turns drinking into a social game. I just wanted a personal log with real data. Different goals, different tools.
One sheet for everything
The best part of switching was consolidating. TasteFlux handles beer, wine, spirits and cocktails in one Library. I used to have Untappd for beer and nothing for everything else. Now a good bottle of wine at dinner and a flight at a brewery sit in the same tracker, with the same spending analytics and the same charts.
If you're fed up with Untappd's paywalls and badge grind, a spreadsheet is a clean reset. You keep your data, you get real analytics and you stop paying a subscription to log your own drinks.
Track every drink, not just beer
TasteFlux is a Google Sheets tracker for beer, wine, spirits and cocktails. Spending analytics, tasting notes and Insights charts. One spreadsheet for everything you drink.
More articles
- Why I Ditched Goodreads for a Spreadsheet
- Letterboxd Is Great but It Can't Do This
- I Replaced My Gaming Backlog App with a Spreadsheet
- I Left Ravelry and Track My Projects in a Spreadsheet Now
- Why I Started Logging Every Drawing I Make
- How I Finally Started Finishing Craft Projects
- How I Track My Comic Collection Without Losing My Mind
- How I Track Every Movie and Show I Watch
- I Tracked Every Book I Read for a Year
- How I Track My Online Courses in Google Sheets
- How to Track Every Concert You Go To
- Why I Track Every Album I Listen To
- How I Finally Got My Gaming Backlog Under Control
- How I Track Everything I Watch, Read and Play in Google Sheets
- Google Sheets vs Notion for Tracking Hobbies
- How to Build a Year-in-Review Dashboard for Your Hobbies
- The Board Gamer's Guide to Tracking Cost Per Play
- Why I Stopped Using Vivino and Started Tracking Wine in a Spreadsheet